
Property Taxes – How Does Illinois Compare?
Property Taxes – How Does Illinois Compare?
May 2022 (75.4)
by Maurice Scholten*
People frequently ask how taxes in Illinois compare to those in other states. The answer to that question depends on who you ask. Advocates for increasing government spending present statistics that show Illinois as a low-tax state, while those who want a more limited role for government present statistics that show Illinois as a high-tax state. We are releasing a series of Tax Facts articles attempting to provide a true picture of where Illinois stands. We first looked at the overall tax climate in Illinois, and then specific tax types. We now turn to property taxes.
Two key points about how we undertake this comparison of state taxes:
● First, it is imperative to look at state and local taxes combined. Some states pay for services with state funds, while others leave that funding to local governments and local taxes. Furthermore, a person buying $100 worth of groceries and other household goods usually does not know (or care) who imposed the sales tax on those goods, and which government receives the tax.
● Secondly, we contend that tax collection rankings should reflect different economies in different states (which often reflect different costs of living and income levels).
For example, let’s assume States A and B both have a flat income tax rate of 5%, but in State A the median personal income is $50,000, and in State B the median personal income is $55,000. As a result, the median State A resident would pay $2,500 in income taxes and the median State B resident would pay $2,750. Even though the two states have the same rate, the State B resident pays more in absolute dollars, but she also has more after-tax income. Does State B have higher taxes, or are they equal? We would posit that they are equal, so a per capita comparison would not adequately capture the differences between State A and B. To reflect this properly, we look at taxes as a percentage of gross state product (the total value of all goods and services produced within the State) to arrive at the percentage of economic output diverted to taxes.
Finally, in terms of presentation, rankings make good headlines, but the bar graphs we use make it easier to visualize if a state is an outlier, and if so by how much. For example, if a state has the highest taxes in the country but is only slightly higher than the national average, then that #1 ranking means very little, because all the states have essentially the same tax burden. On the other hand, if a state is ranked 10th but it is significantly above average, the fact that nine states have higher taxes does not provide much comfort to that state’s citizens.
We use the most recent data that the Census Bureau has released, which is for FY 2019. This data predates COVID-19 which has had a significant impact on everything, including state and local taxes. We will update these charts when the Census Bureau releases updated data.
Property Taxes
A tax on property is one of the oldest taxes. It is also one of, if not the most vilified taxes. People don’t like it for a variety of reasons: payments are generally in two yearly lump sum installments, rather than spread out over time like other taxes; the tax is based on the value of property, which can be subjective; and ability to pay the tax is generally irrelevant. Additionally, the property tax process is a lengthy one–property is valued as of January 1 and taxpayers get their bills about 16 months later (even later in Cook County). By the time a taxpayer receives their bill, the time for appeals have ended. And of course, in Illinois, it is a high tax.
It is also a complicated tax, involving a variety of governmental bodies and officials, including the following:
● The first step in the property tax process is determining the value of every piece of land and the associated improvements in the state. These values are determined by local assessors. Once values are determined, property owners can appeal their values.
● While this process plays out, local governments (school districts, municipalities, etc.) vote on how much money they should collect through property taxes and forward the results to the county clerk.
● The county clerk determines if the local governments are legally allowed to collect the requested amount of property tax or whether it exceeds state-imposed tax caps. The county clerk then calculates the tax rate required in order for each local government to collect the requested amount or the maximum rate allowed by law, whichever is lower.
● Next, the county treasurer calculates each property’s tax bill by listing each local government that can collect taxes from the property and what the tax rate is for that unit of government. The total tax rate is multiplied by the assessed value of the property, after all relevant exemptions are taken into account, to equal the tax due. A bill is then sent to each taxpayer. If a taxpayer does not pay their taxes, the county begins a very lengthy process to sell the property in order to receive the taxes due.
PROPERTY TAXES IN ILLINOIS ARE HIGH
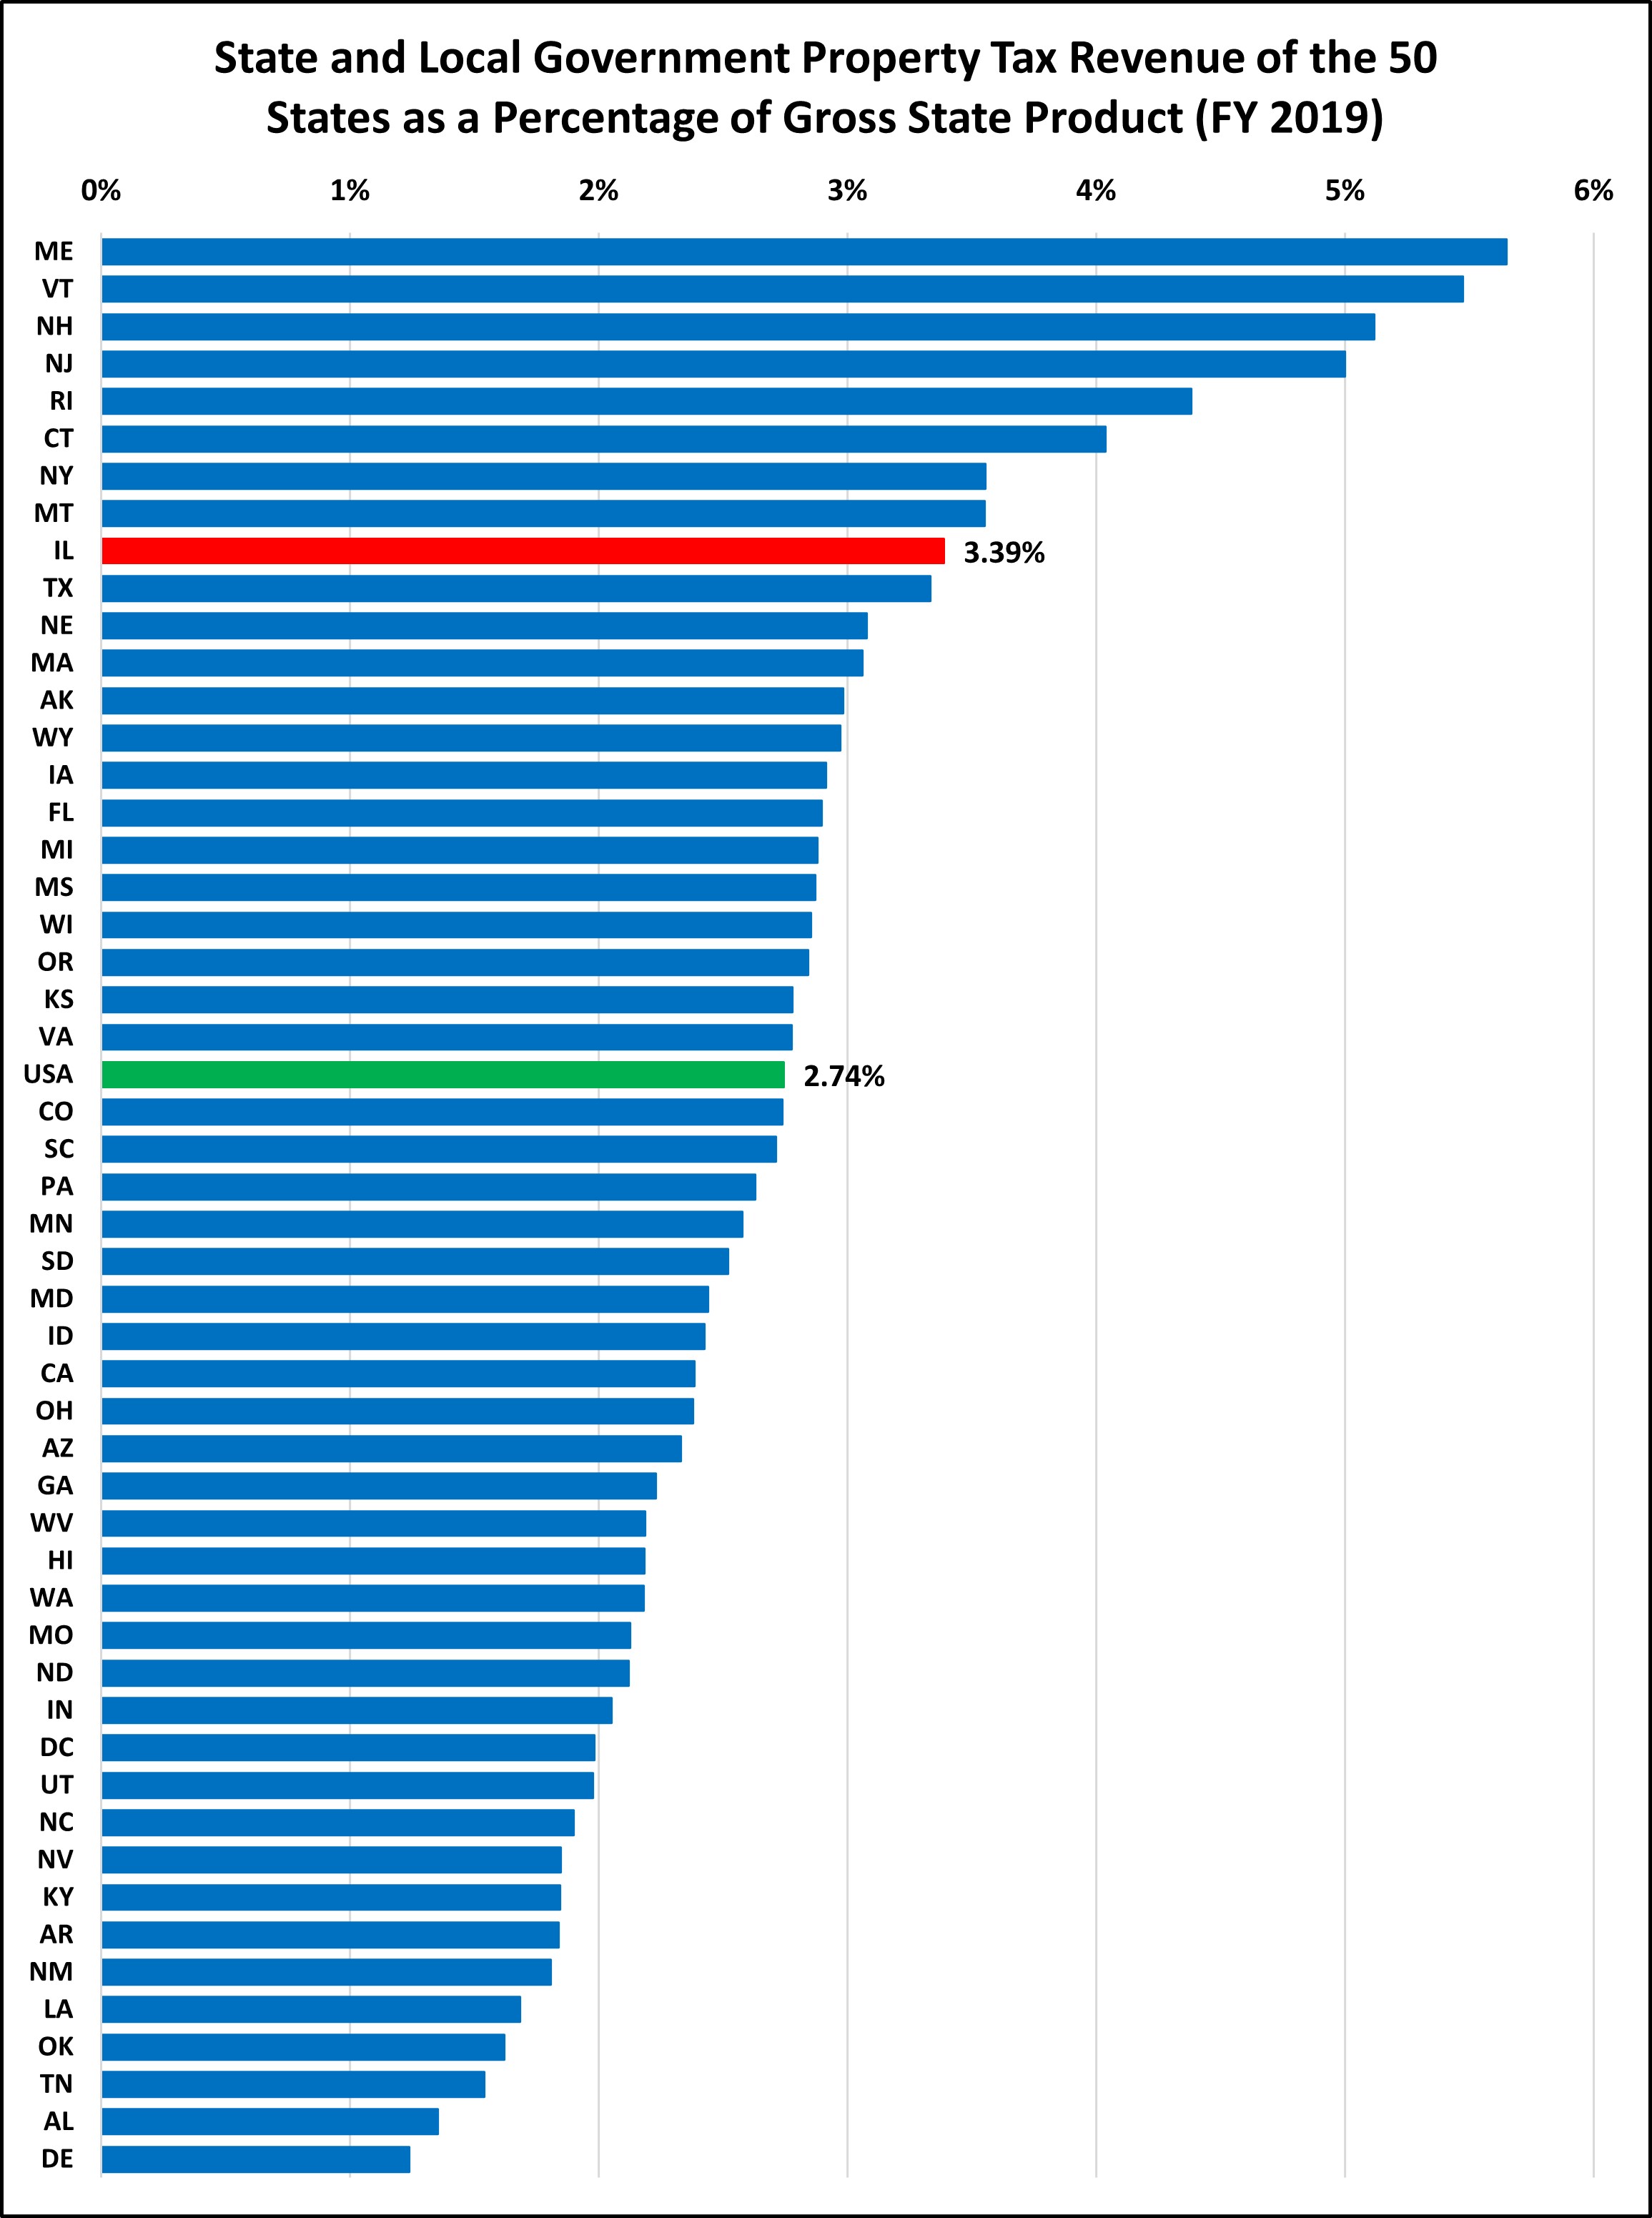
Illinois is often cited as having the highest property taxes in the country. That ranking, however, depends on how property taxes are measured. As a percentage of gross state product, property taxes in Illinois are definitely above average, but they are not the highest.
ILLINOIS RESIDENTIAL MEDIAN EFFECTIVE PROPERTY TAX RATES ARE SECOND HIGHEST IN THE COUNTRY
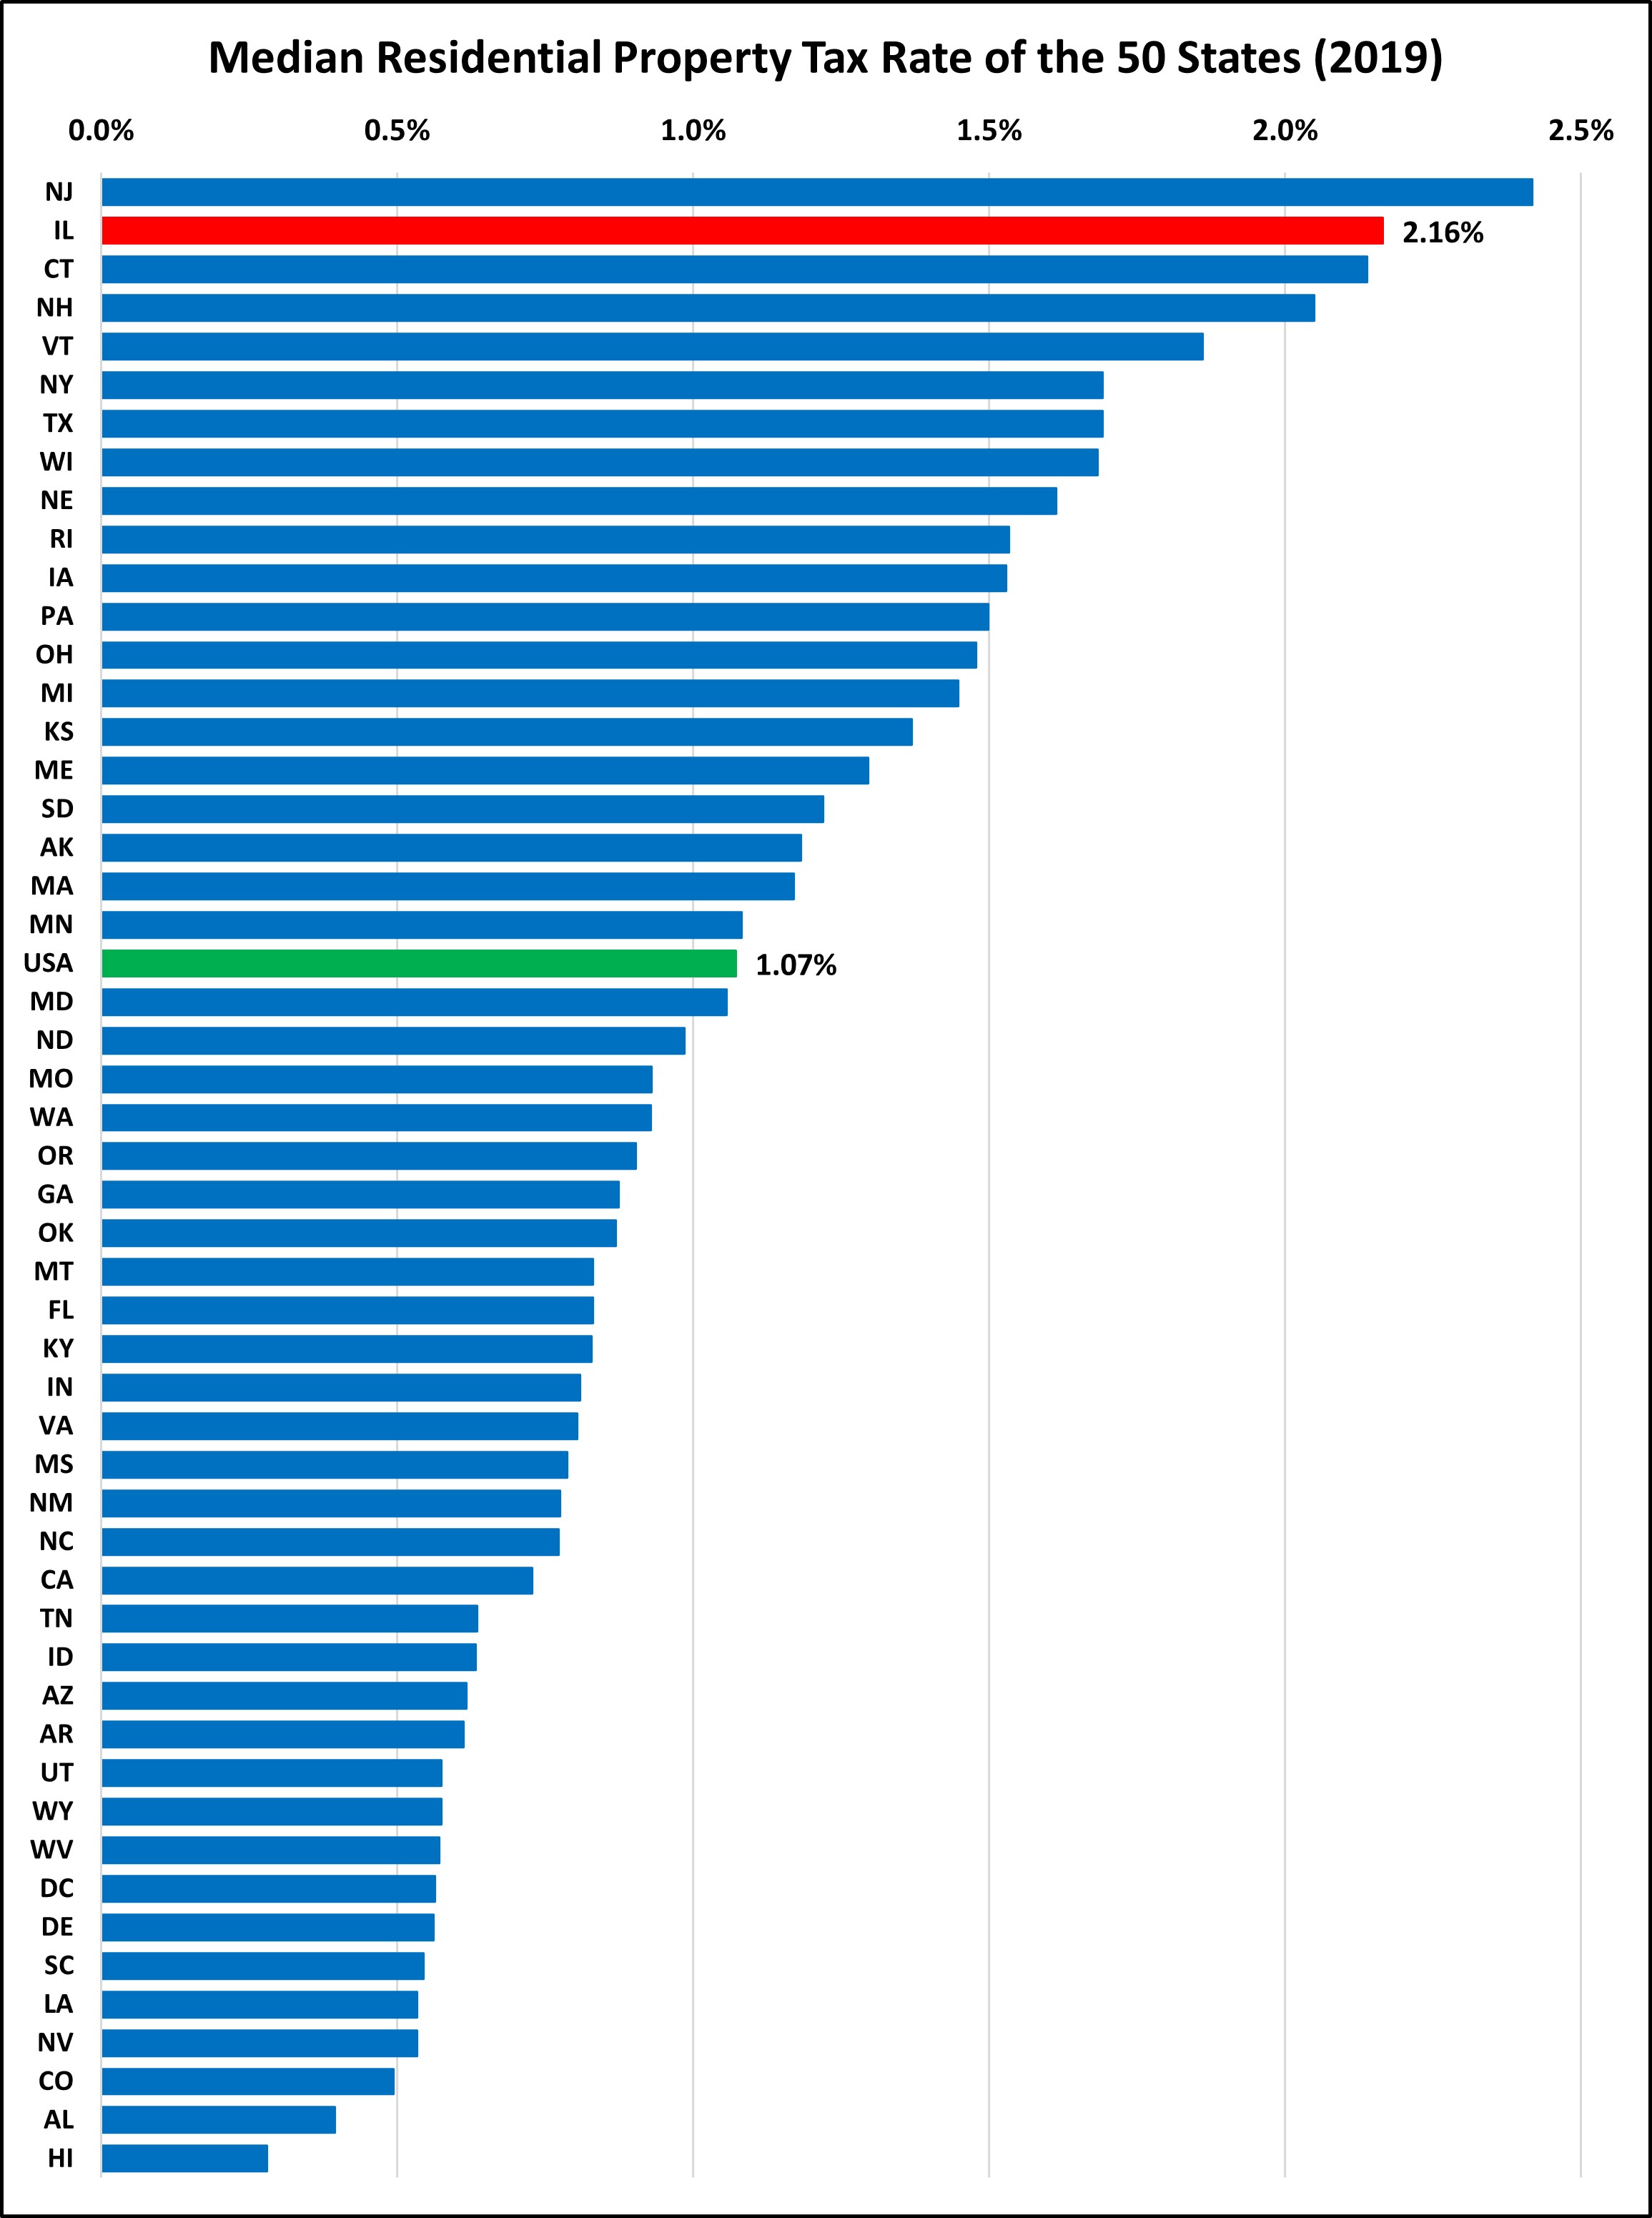
Effective rates are calculated by comparing a home’s taxes to its fair market value. We use median—the middle number—rather than average (mean) because high-value homes skew the data. Using this measure, Illinois jumps to almost the highest in the country, second only to New Jersey.
ILLINOIS RESIDENTIAL MEDIAN PROPERTY TAX BILLS ARE SIXTH HIGHEST IN THE COUNTRY
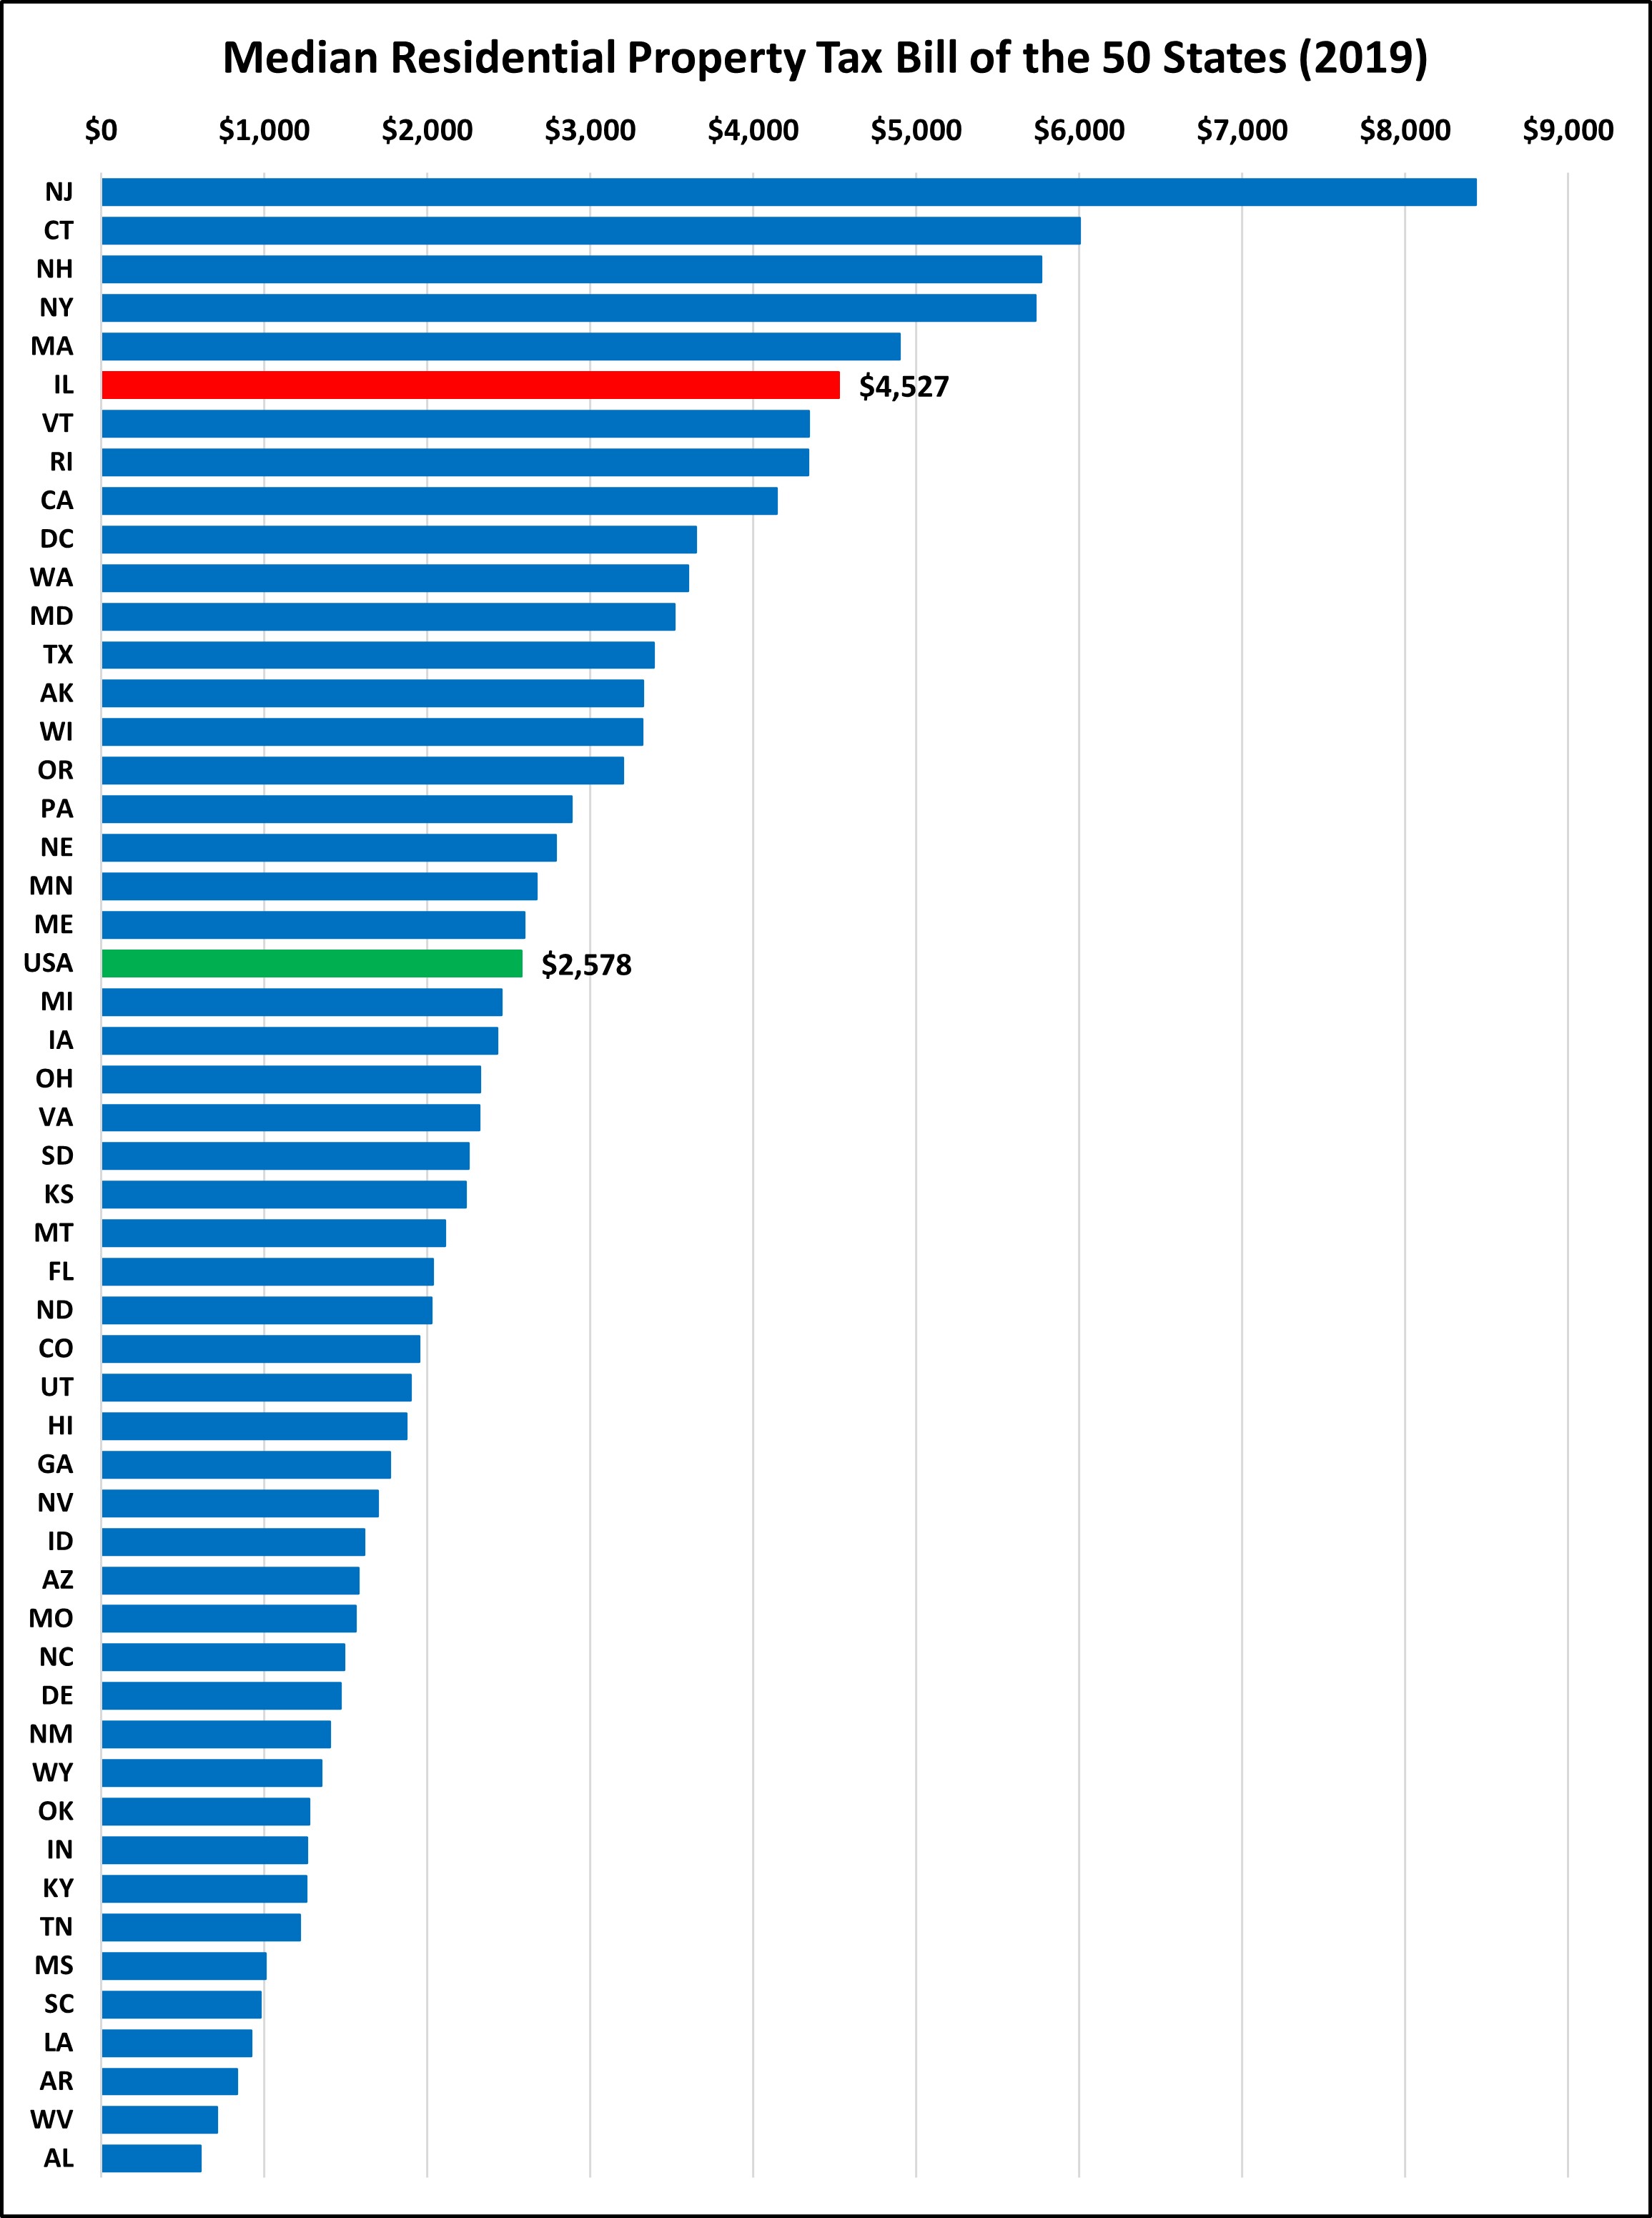
The average homeowner cares more about how much they pay in property taxes than the total property tax collections in the state or even their tax rate. Looking at the median property tax bill for owner-occupied residential real estate, Illinois is once again significantly above average, at 6th highest. The reason for the difference in rankings for property tax rate and property tax bill is property value. The median property value in Illinois is slightly below the national median, meaning that our high-ish property tax bills are a result of a high effective rate. For all of these measurements, it’s important to remember we are looking at a state-wide median. Within Illinois, these amounts can vary greatly from one community to another.
ILLINOIS RESIDENTIAL MEDIAN PROPERTY VALUE IS SLIGHTLY LOWER THAN AVERAGE IN THE COUNTRY
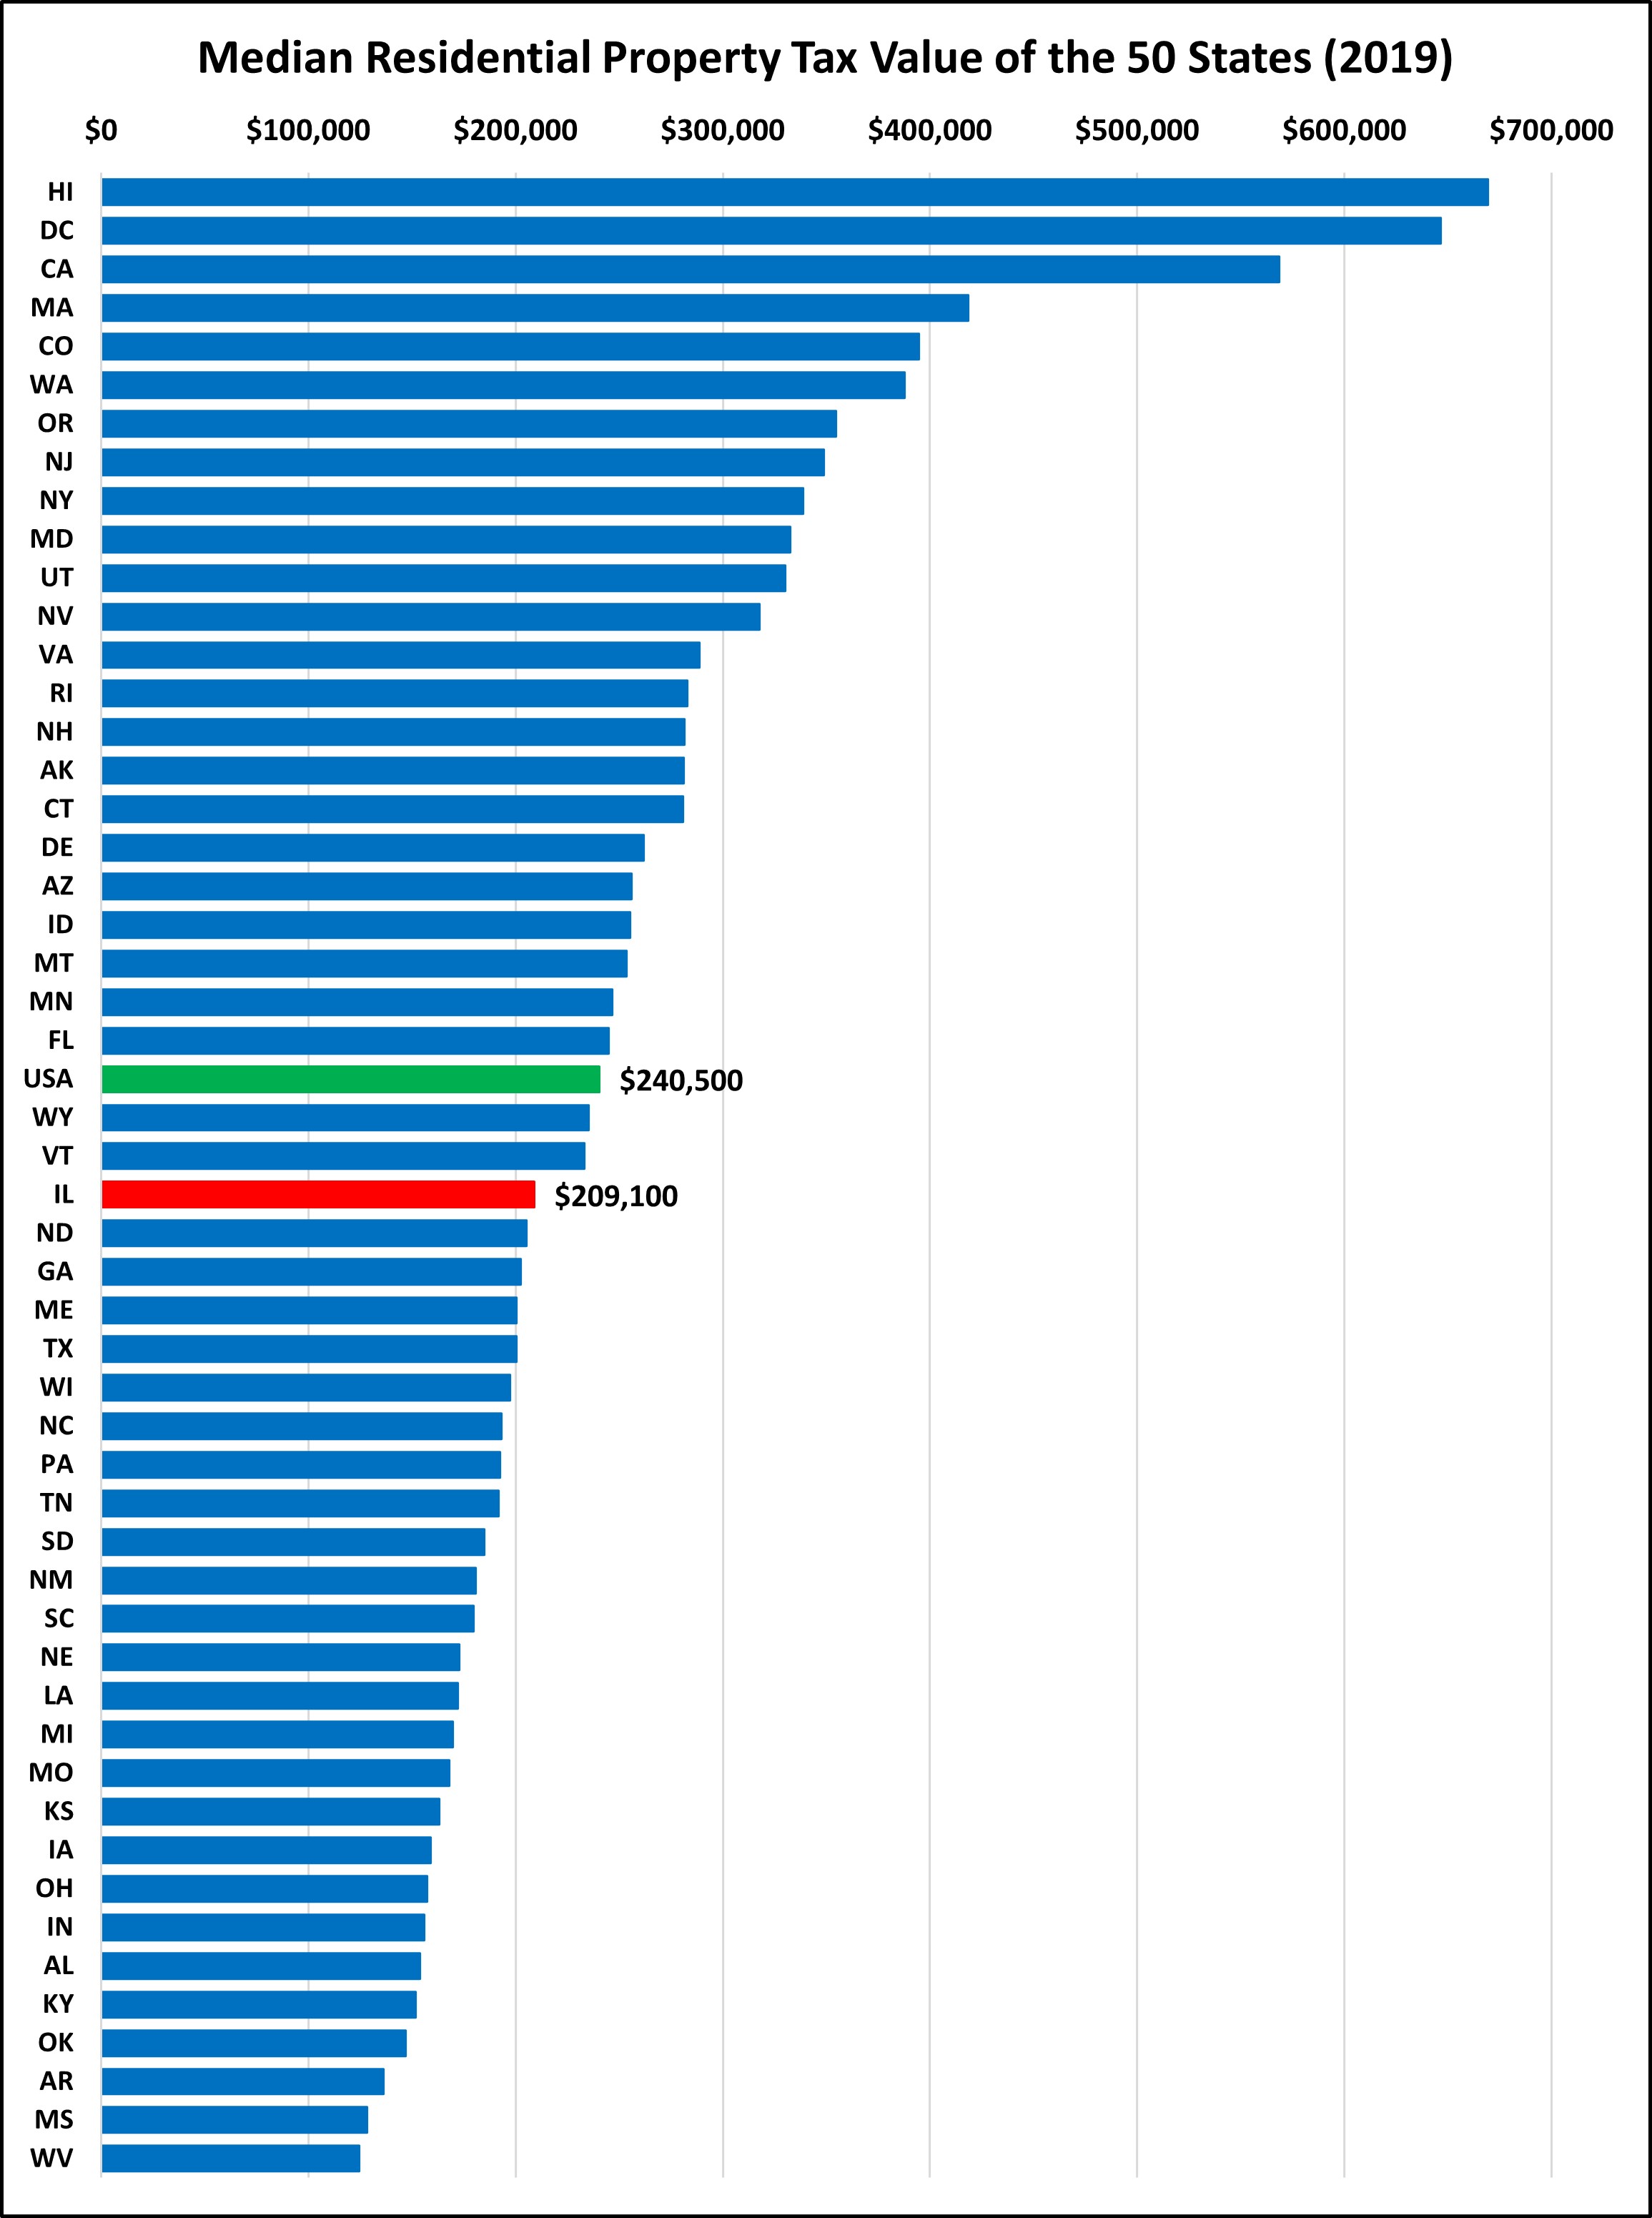
Here we can see that the median home value in Illinois is below the national median value. This is a net positive for the state as workers are more likely to be able to afford a home in Illinois than other states with large metropolitan areas, such as California, New York, and Massachusetts. However, as we’ll see, this varies widely within the state: the median property value in Cook and the collar counties is above $200,000, but below $200,000 for most other counties.
PROPERTY VALUES AND TAX RATES VARY WIDELY ACROSS THE STATE
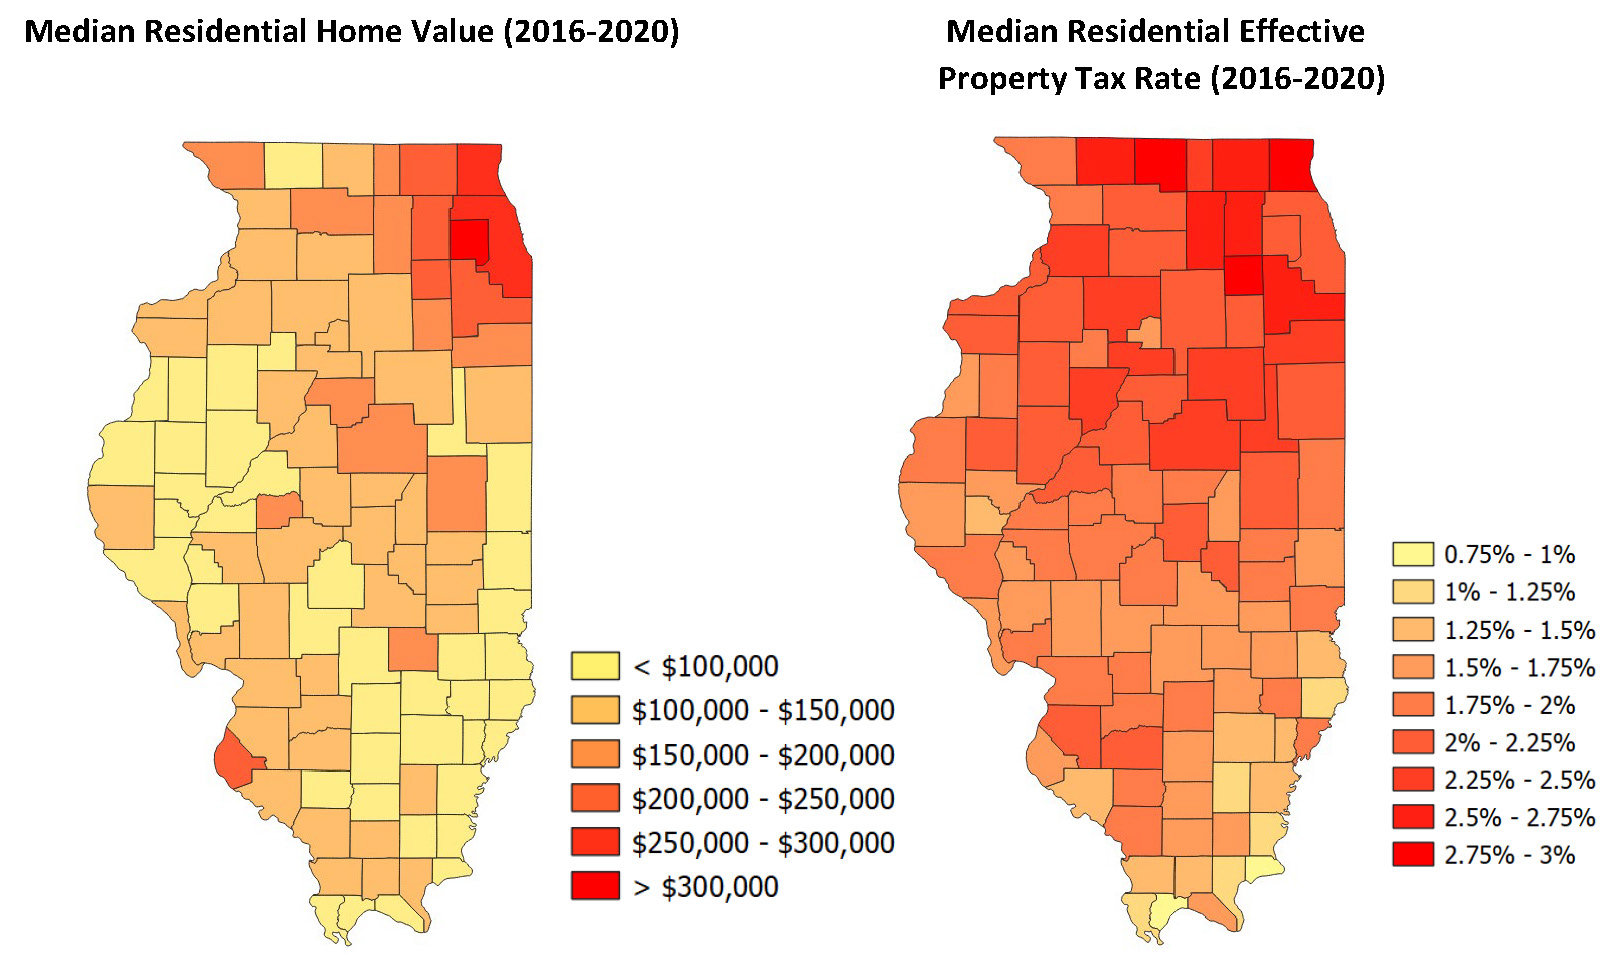
The map on the left shows how property values differ in Illinois, with Cook and the collar counties having the highest values. Perhaps the most surprising point is that 41 counties have a median home value less than $100,000. The chart on the right shows the differences in tax rates throughout the state. Generally speaking, tax rates are lower in southern parts of the state, and the rate increases as you travel north.
PROPERTY TAX BILLS ALSO VARY WIDELY WITHIN ILLINOIS
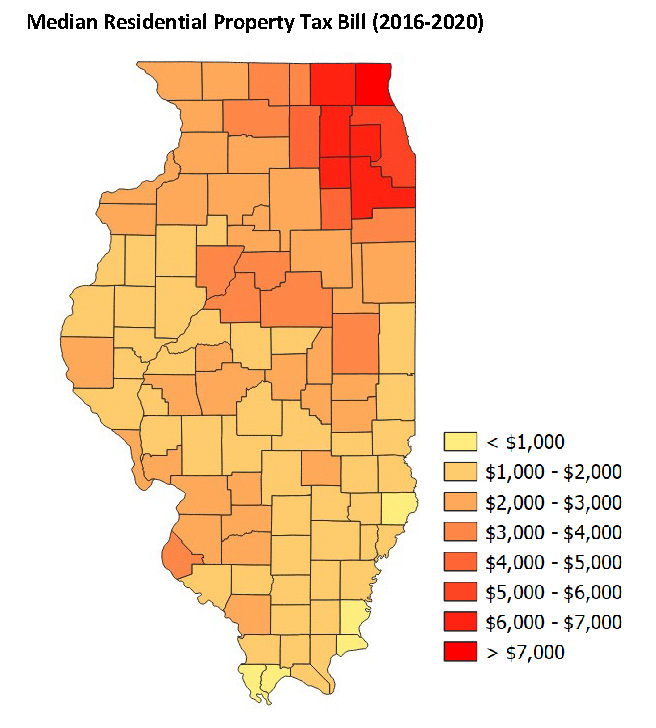
Here we can see what the median home in each county pays in real estate taxes. While the median tax bill in Illinois as a whole is $4,527, the median bill for each of the collar counties is at least $6,000. And 50 counties have median property taxes that are less than $2,000. When looking at the county-by-county charts together, Lake County has the second highest median property value and the second highest tax rate which results (not surprisingly) in the highest median tax bill of $7,587.
ILLINOIS PROPERTY TAXES HAVE HISTORICALLY BEEN ABOVE THE NATIONAL AVERAGE
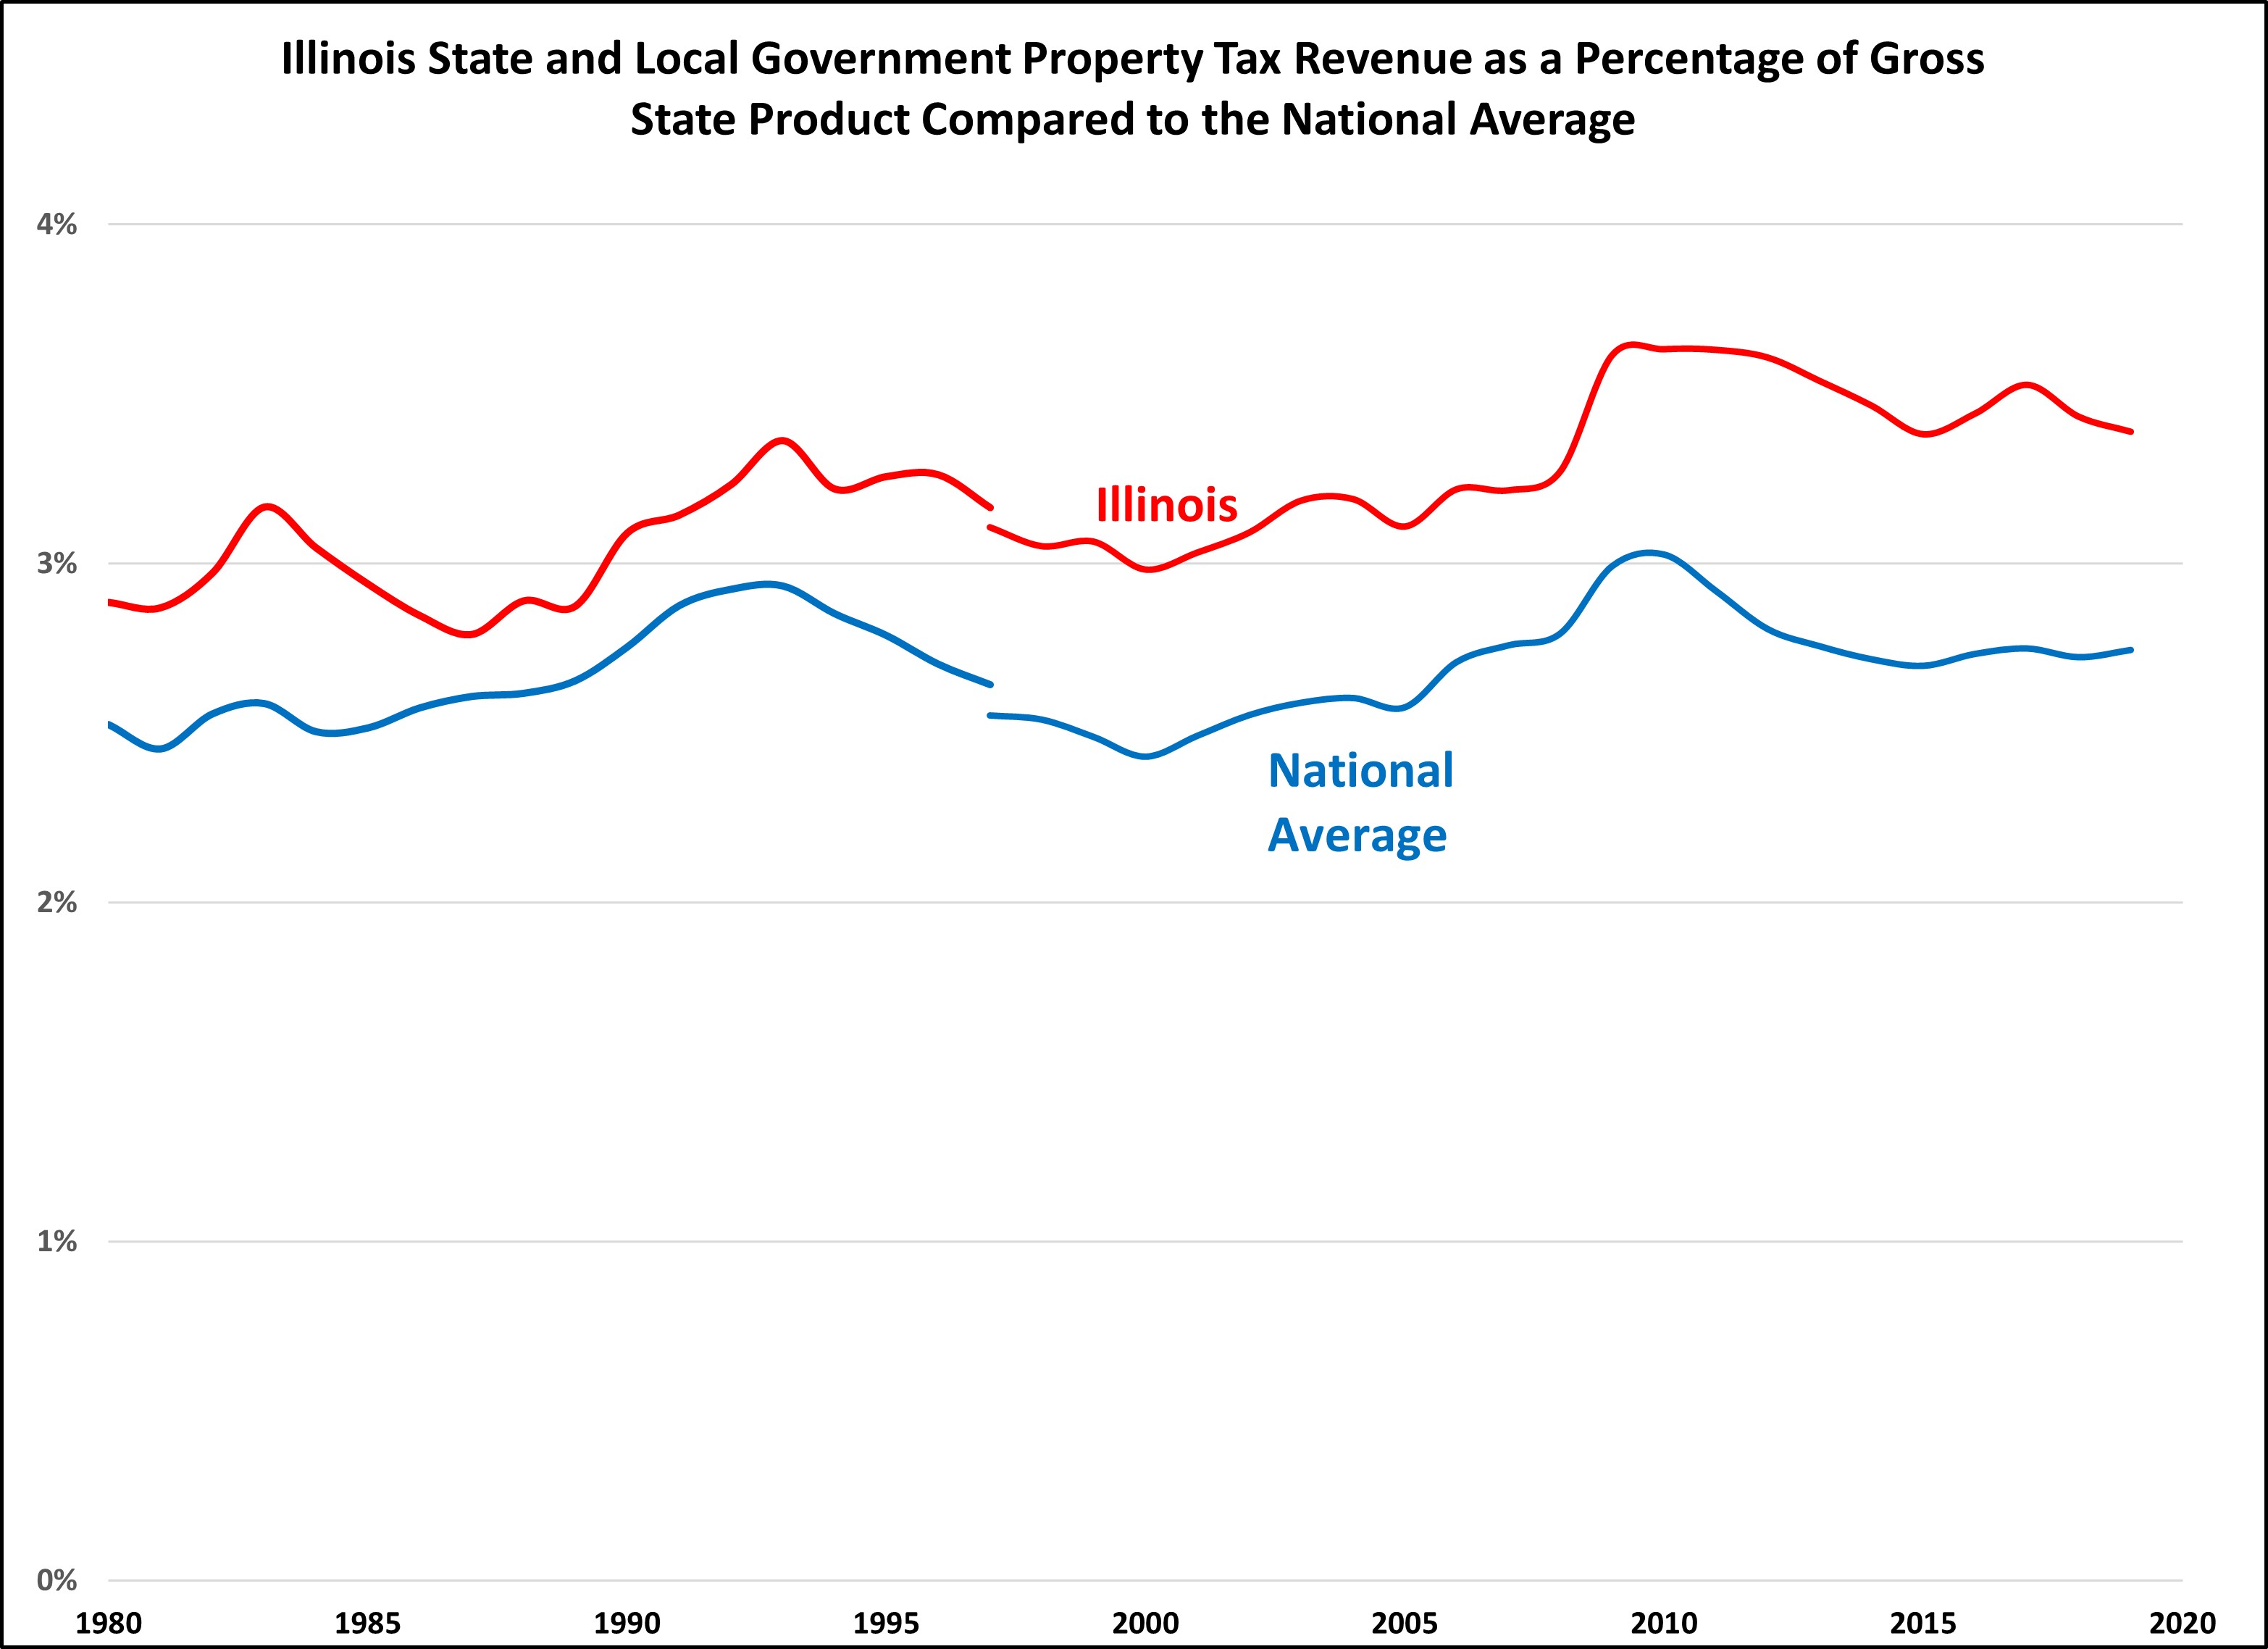
Property taxes in Illinois have consistently been above the national average. Between 2007 and 2010, property taxes increased quickly. While property taxes as a percentage of gross state product started decreasing after 2010, there was a larger decrease nationally than in Illinois.
WHILE SPECIAL DISTRICTS ARE THE MOST COMMON TAXING BODY, SCHOOLS RECEIVE THE MAJORITY OF PROPERTY TAXES
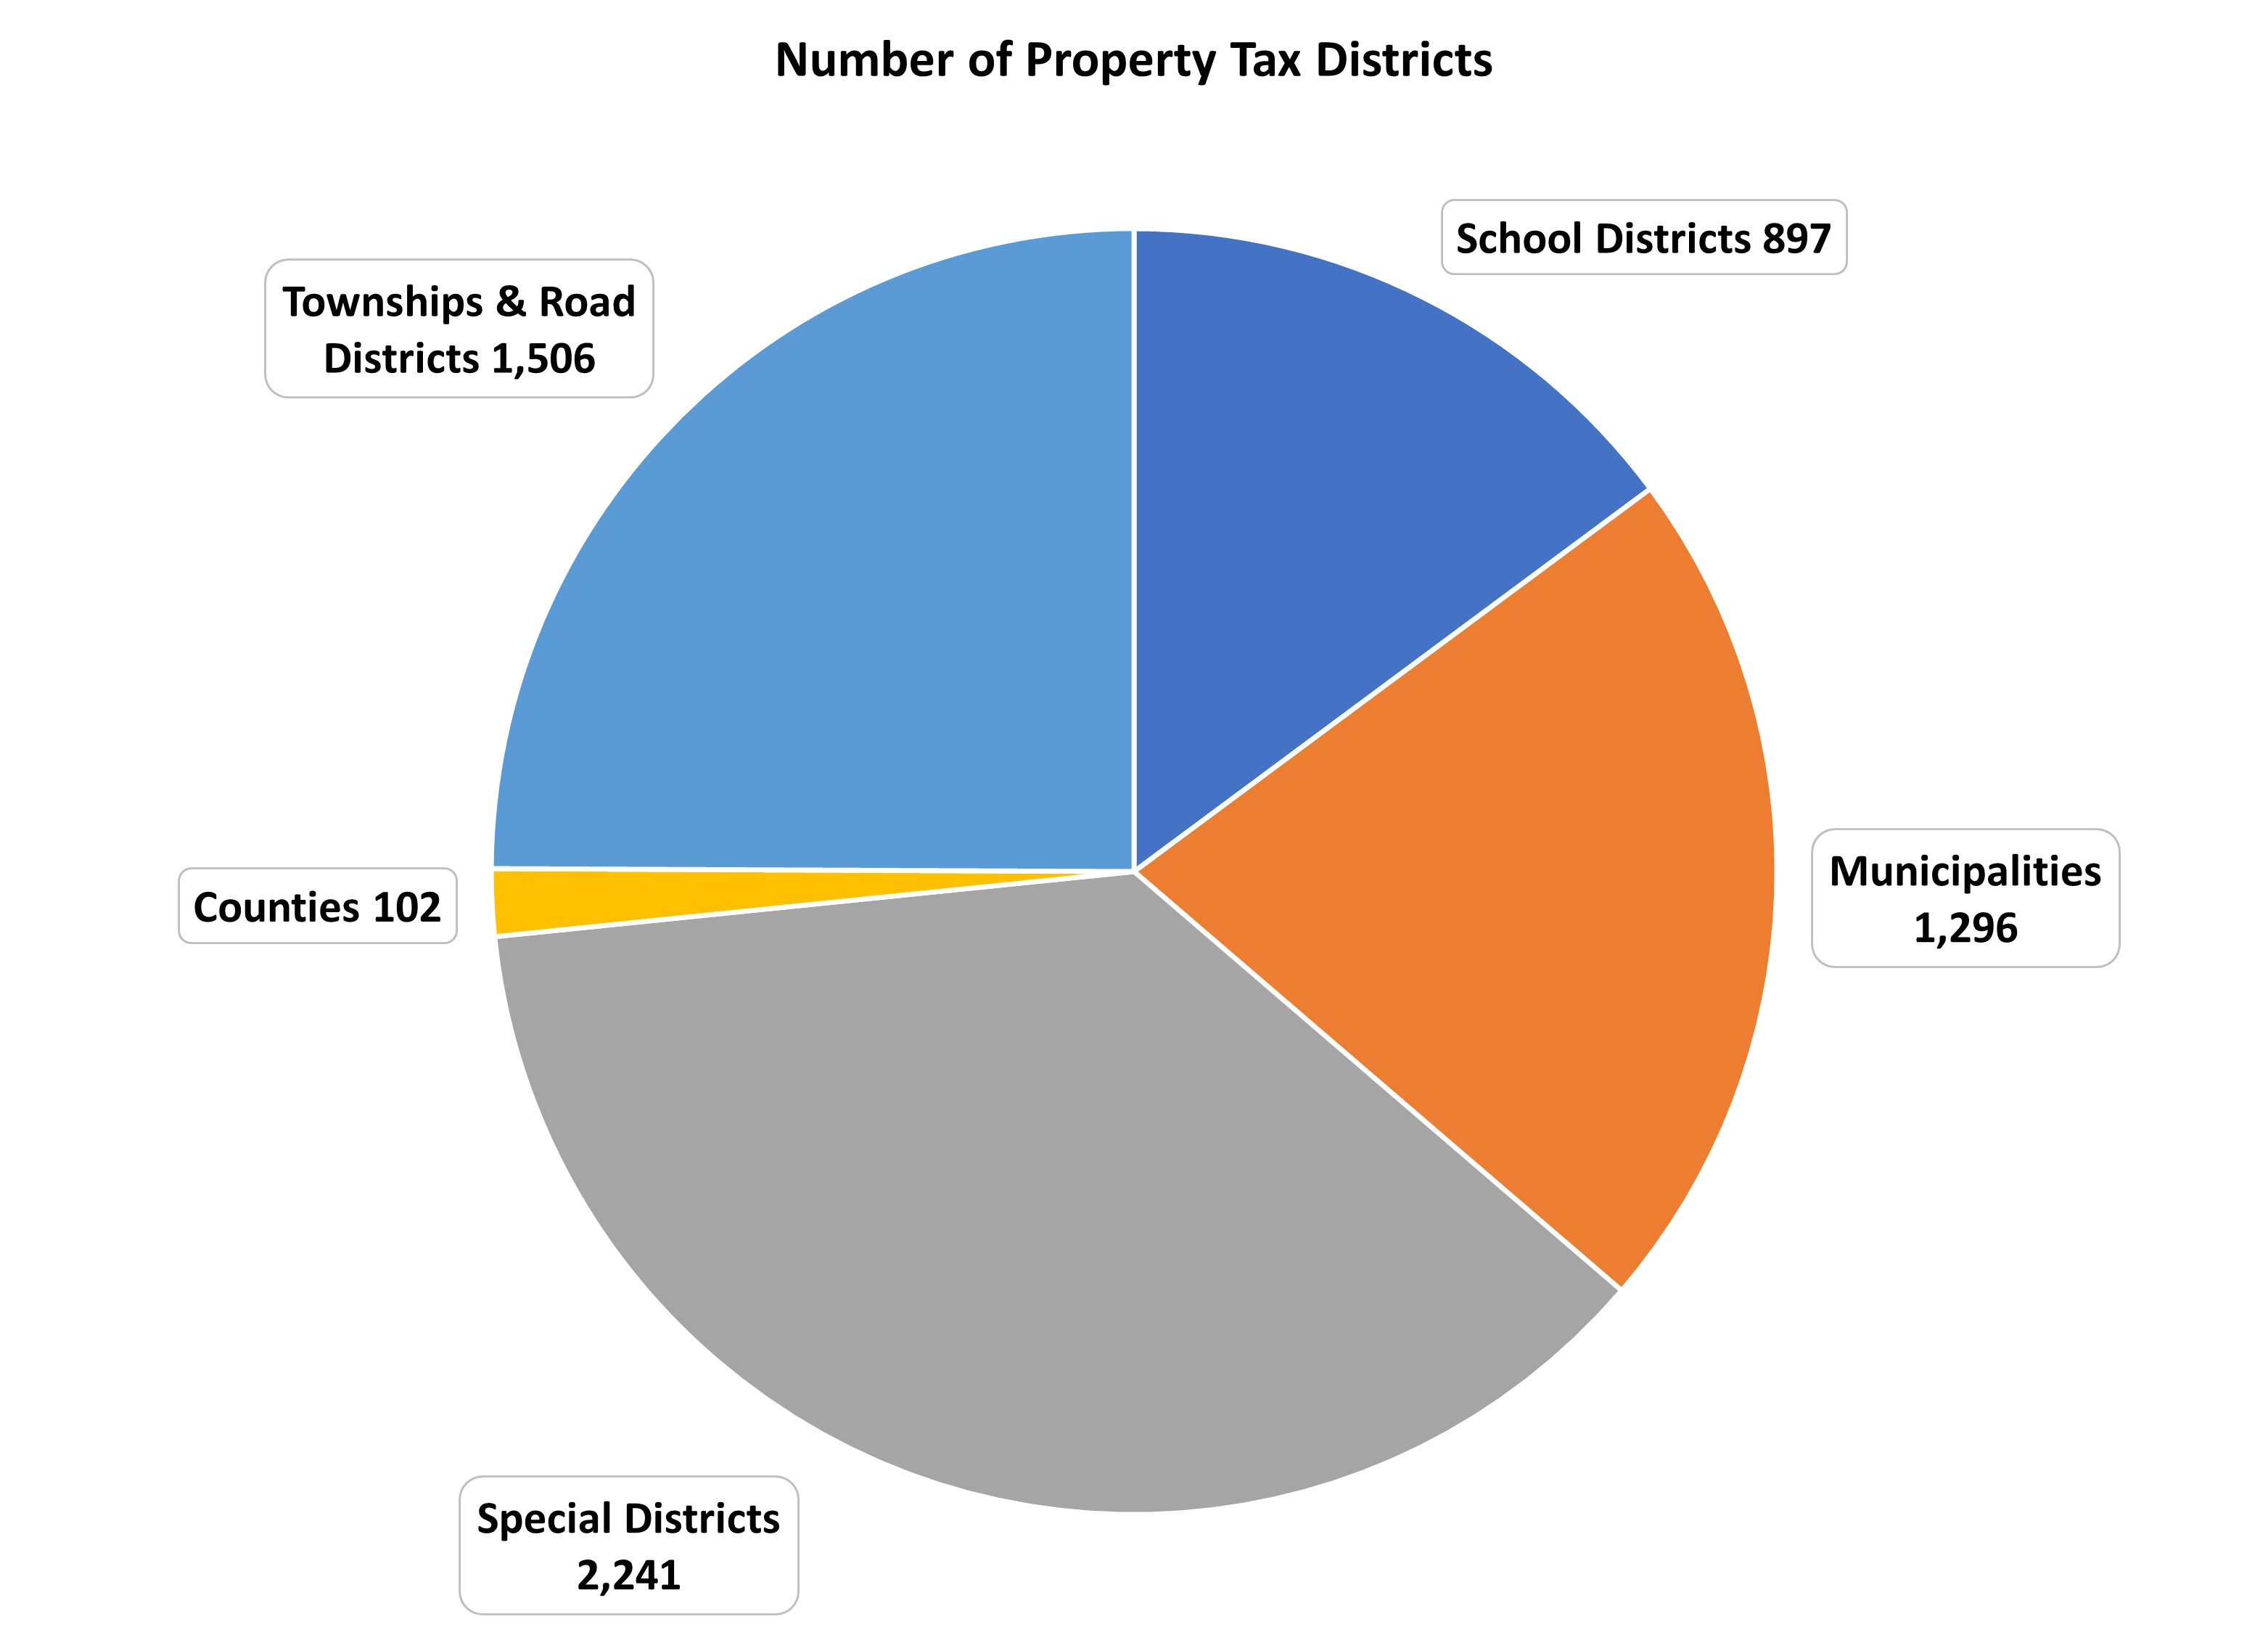
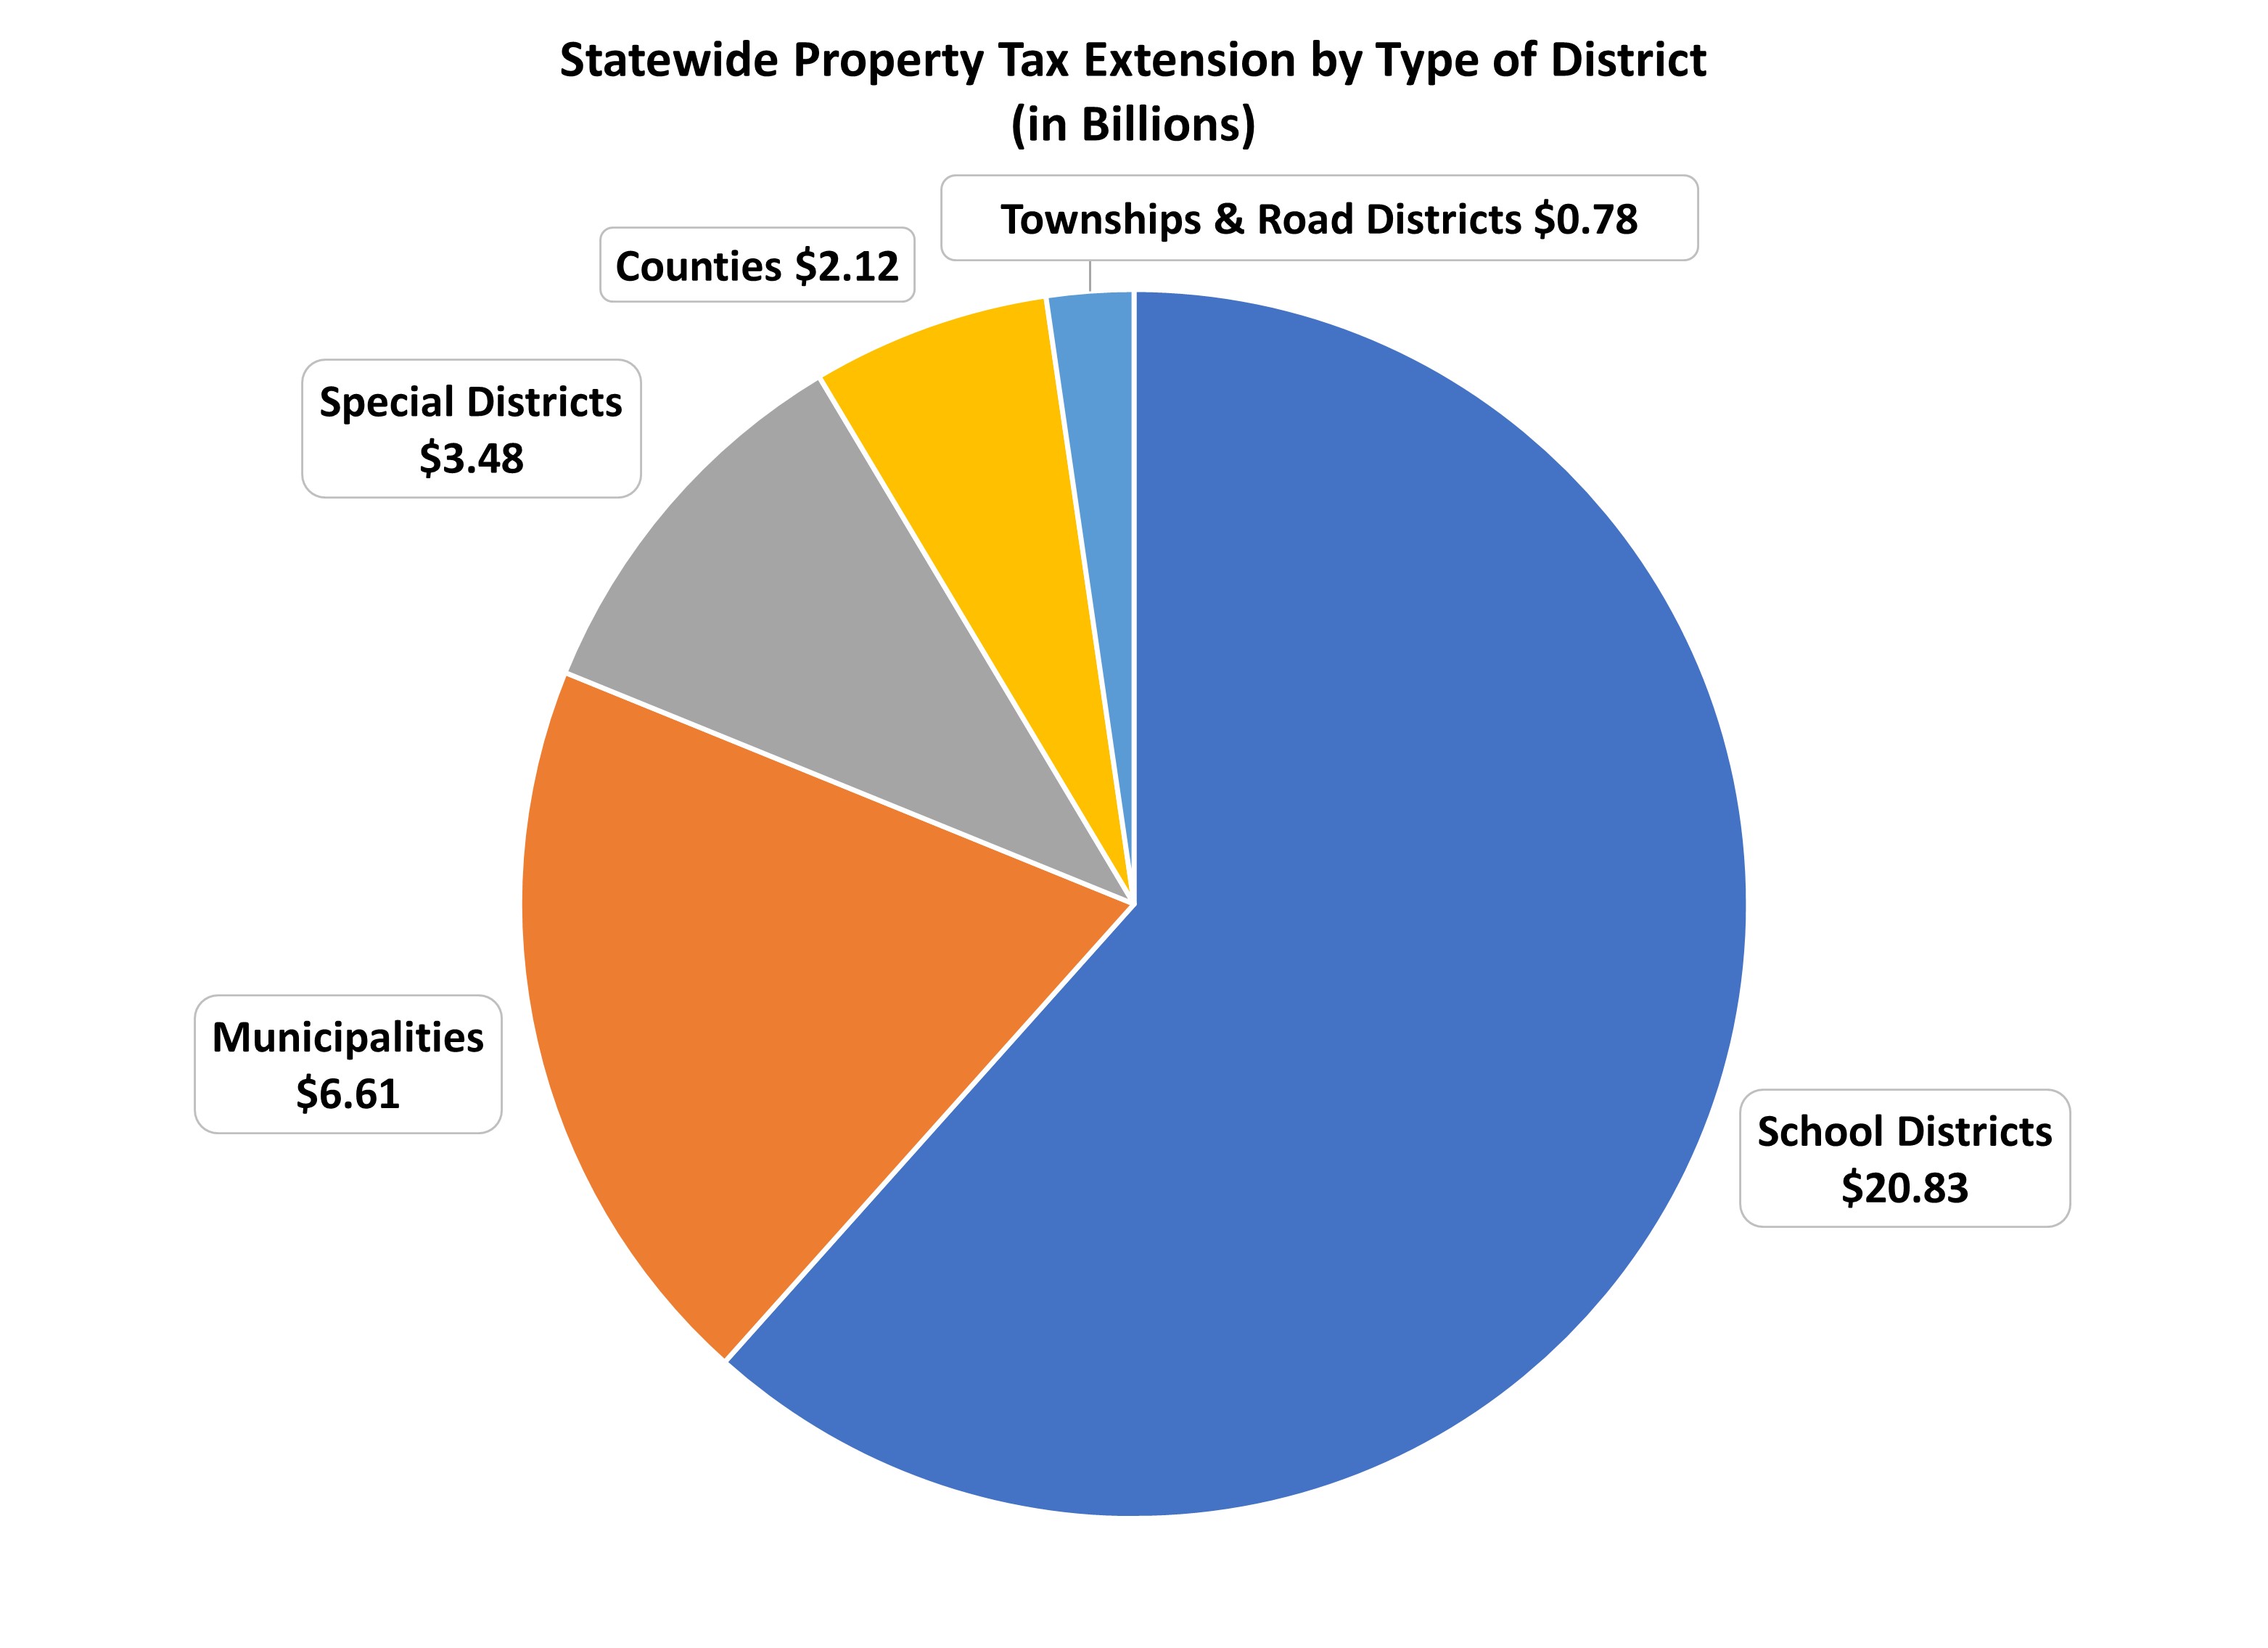
It is well known that Illinois has more units of local government than any other state. Special districts, townships, and road districts make up 62% of local government units that levy property taxes. However, they only levy 13% of all property taxes. In contrast, school districts make up 15% of the taxing districts, but receive 62% of the taxes. Consolidating local governments is often cited as a way to cut taxes, but if half of the taxes collected by special districts, townships, and road districts could be saved through consolidation (probably too high of a figure), statewide, property taxes would only decrease by 6.3%.
METHODOLOGY
Charts like these are only as good as the underlying data. The charts consistently rely on data from the United States Census Bureau, specifically, the Annual Survey of State and Local Finances. Some states have taxes which do not fit neatly into a category, such as Washington’s Business and Operations Tax, a gross receipts tax on businesses. Some might think it should be classified as a corporate income tax. However, the census classifies it as a sales and excise tax. There are other instances where the Census guidelines and classifications may not be intuitive, but for simplicity and consistency, we follow the Census classifications.
We are aware of flaws in the Census data. The sales tax data for Illinois was incorrect for approximately twenty years. For FY 2018 & FY 2019, there was a mistake with Illinois’ individual and corporate income tax data. The Census will update this figure but until then, we are using the corporate and individual income tax data from the Illinois Comptroller. Additionally, the Census did not perform the State and Local Government Survey in 2001 and 2003 so data is unavailable for those years.
Despite these faults with the Census data, it is the best data source that exists to compare state and local government taxes.
In 1997, the U.S. Bureau of Economic Analysis changed how gross domestic product and gross state product were calculated, resulting in a slightly higher value. This is why there is a break in the historical chart above.
* Maurice Scholten is Legislative Director of the Taxpayers’ Federation of Illinois.