TFI Tax Facts (78.1): An Illinois Chartbook: How Does Illinois Compare?
An Illinois Chartbook
How Does Illinois Compare?
fffffffff
February 2025 (78.1)
People frequently ask how Illinois taxes compare to those in other states. The story of the six blind men and the elephant comes to mind. In the story, each man touches a different part of the elephant—its side, trunk, tusk, leg, ear, and tail. Each has a different experience based on the part they touch. An accurate picture of the elephant emerges only when they combine their experiences. Similarly, no single chart or figure fully captures the complexity of taxes in Illinois.
In this article, and throughout the series of articles we are publishing this year comparing Illinois taxes to those in other states, we will offer a variety of perspectives to provide a more complete picture. A few notes on the data we use, before we begin:
- To present an accurate comparison, we examine state and local taxes combined. Some states fund services primarily through state taxes, while others rely on local governments and local taxes. Additionally, when a person buys $100 worth of groceries and household goods, they typically do not know (or care) which level of government imposes the sales tax and which receives the proceeds.
- Tax collection rankings should account for the differing economies of each state, which often reflect variations in the cost of living and income levels. For example, assume States A and B both have a flat income tax rate of 5%, but in State A, the median personal income is $50,000, while in State B, it’s $55,000. As a result, the median resident of State A would pay $2,500 in income taxes, while the median resident of State B would pay $2,750. Despite having the same tax rate, the State B resident pays more in absolute terms, but also has more after-tax income. So, do State B residents face higher taxes? While they pay more in absolute terms, proportionally they pay the same. To address this issue, we look at taxes as a percentage of gross state product (GSP)—the total value of all goods and services produced in the state. This measure reflects the portion of economic output devoted to taxes and does not require adjustments for inflation or changes in population.
- We use the most recent data released by the Census Bureau, which covers FY 2022 (July 1, 2021 – June 30, 2022). This is the second fiscal year fully impacted by COVID-19, which had a substantial effect on state and local taxes.
ILLINOIS CONTINUES TO SEE HIGHER TAXES OVER HISTORICAL AVERAGES
Source: U.S. Census Bureau, State and Local Government Finances and Bureau of Economic Analysis,
TFI Calculations
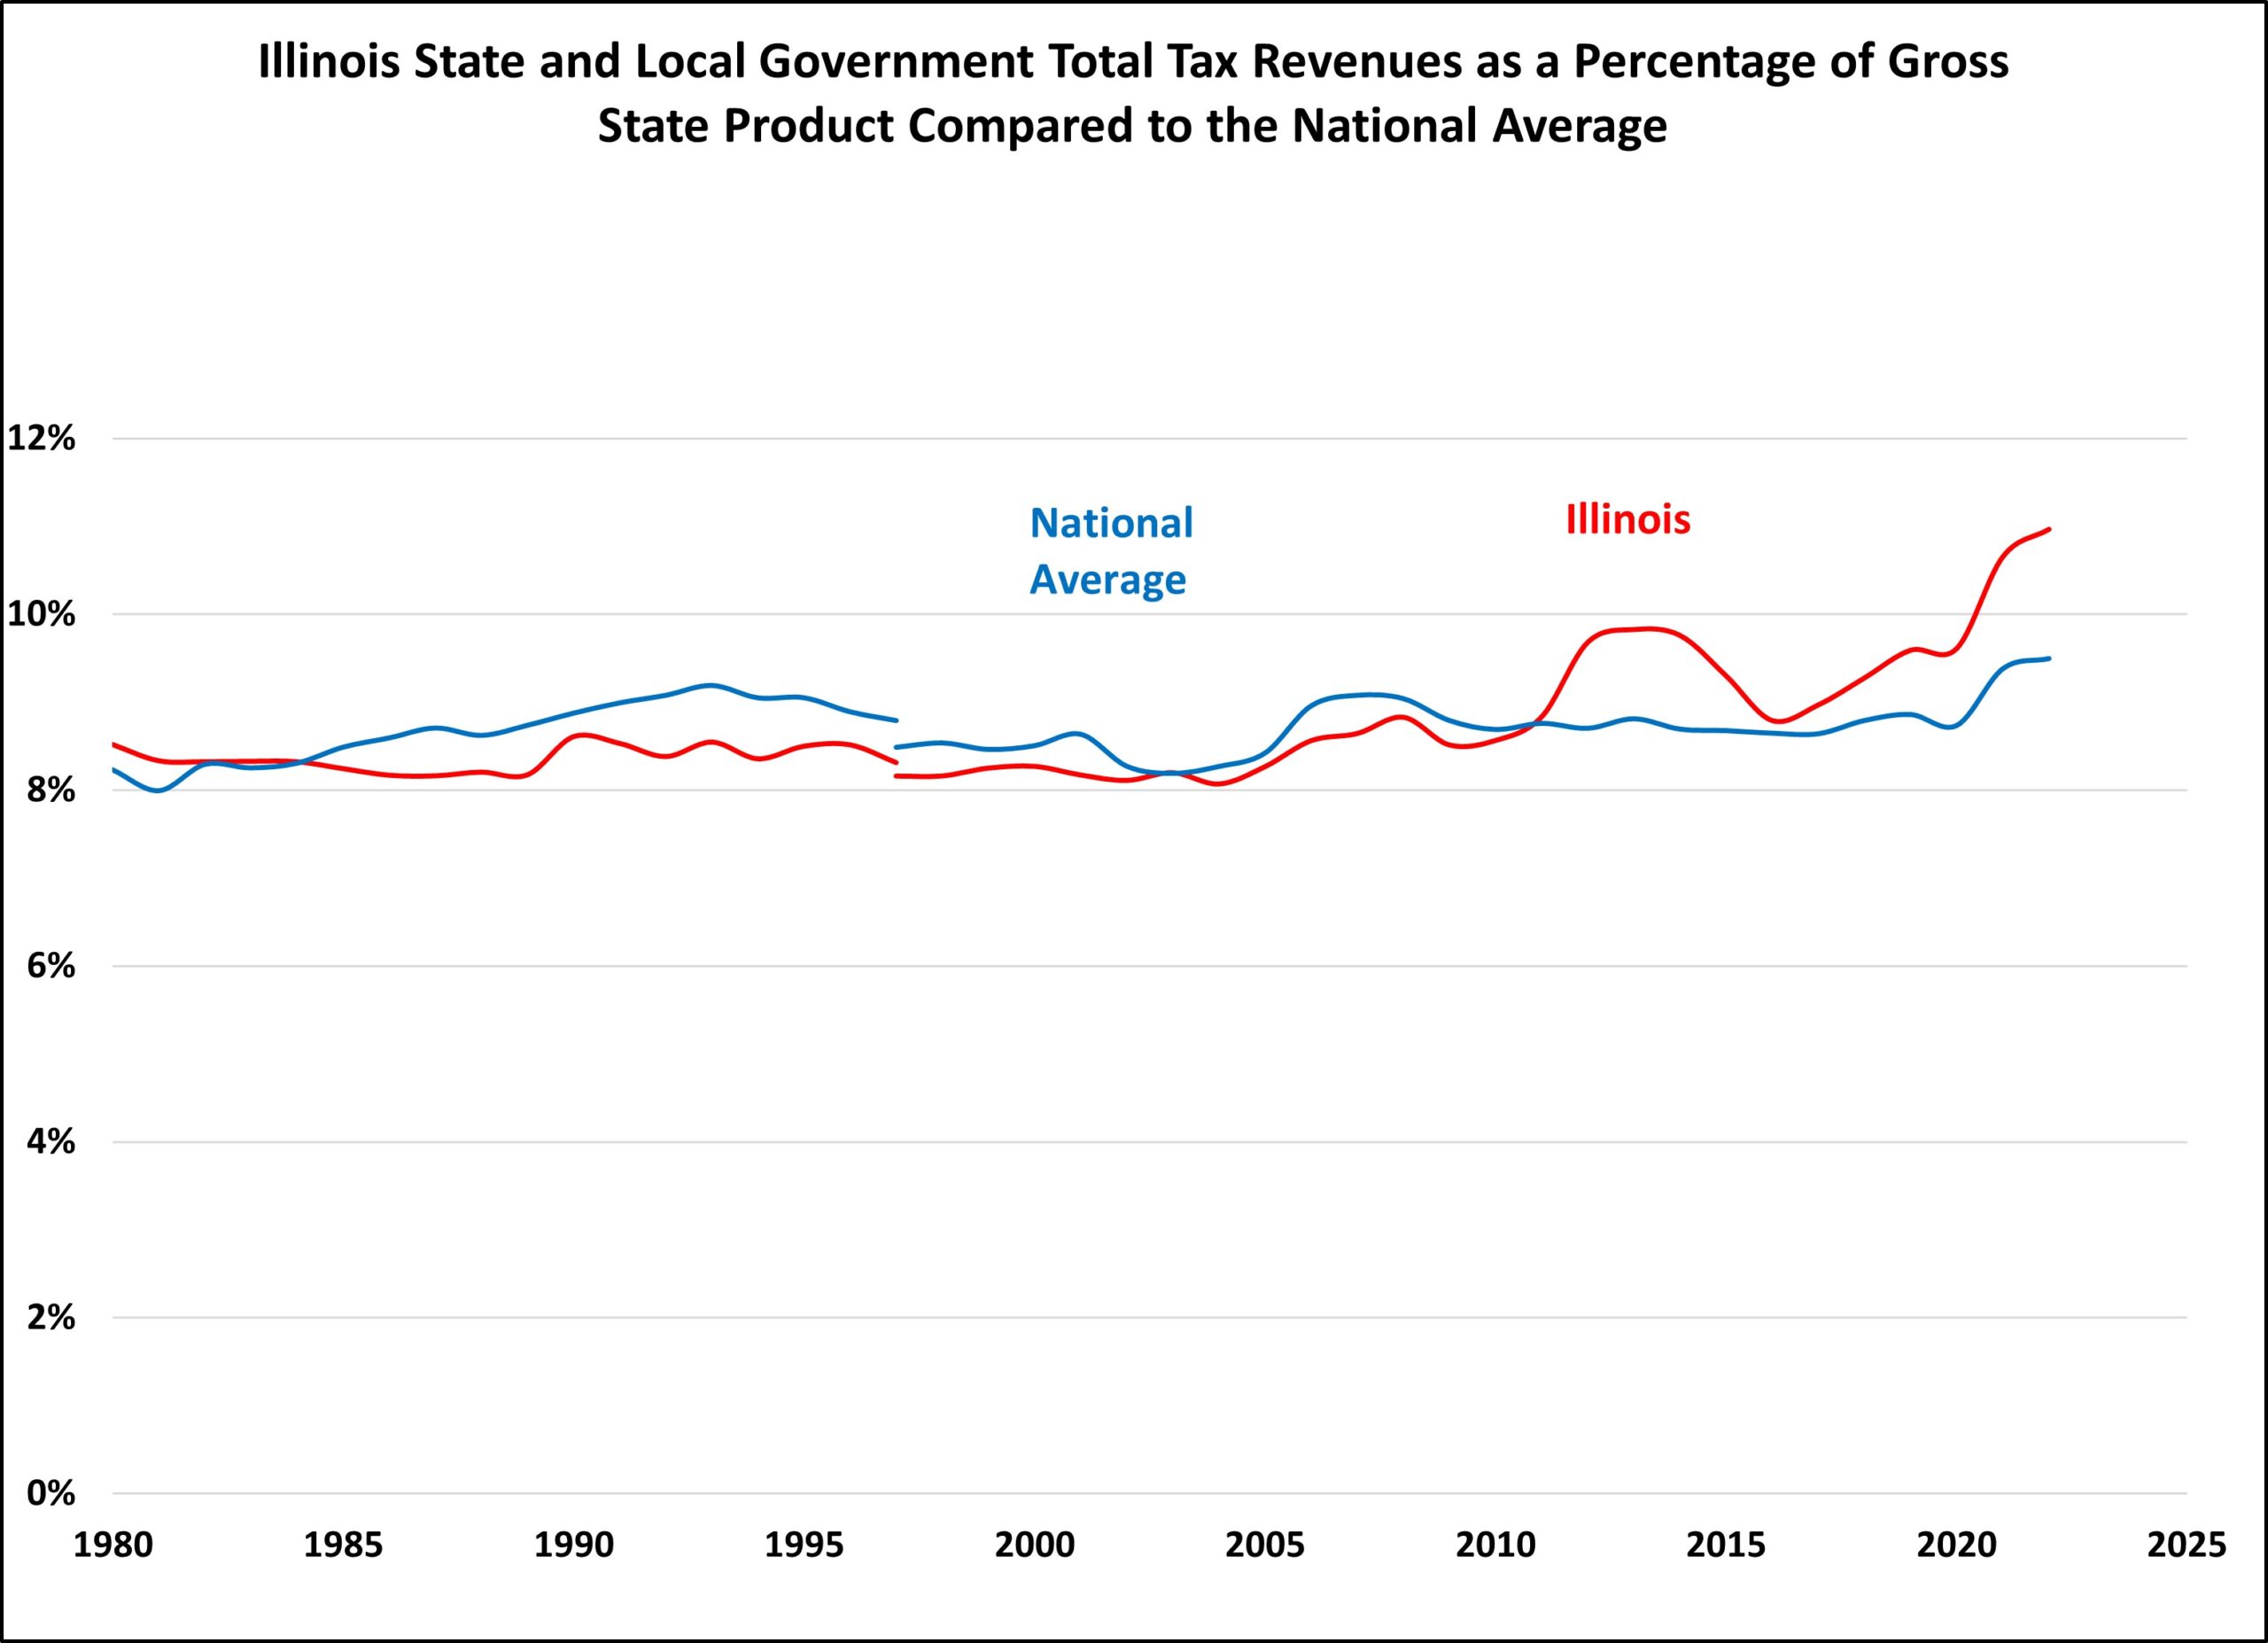
Illinois’ tax collections have continued to increase in recent years. Historically, Illinois’ total state and local tax collections as a percentage of gross state product has been slightly below the national average. However, Illinois started to be significantly higher than the national average due to the income tax increases in 2011 and 2017. The divergence seems to be increasing, possibly because a large number of states have been reducing taxes while Illinois has not.
MOST TAX TYPES IN ILLINOIS ARE HIGHER THAN THE NATIONAL AVERAGE
Source: U.S. Census Bureau, State and Local Government Finances and Bureau of Economic Analysis,
TFI Calculations
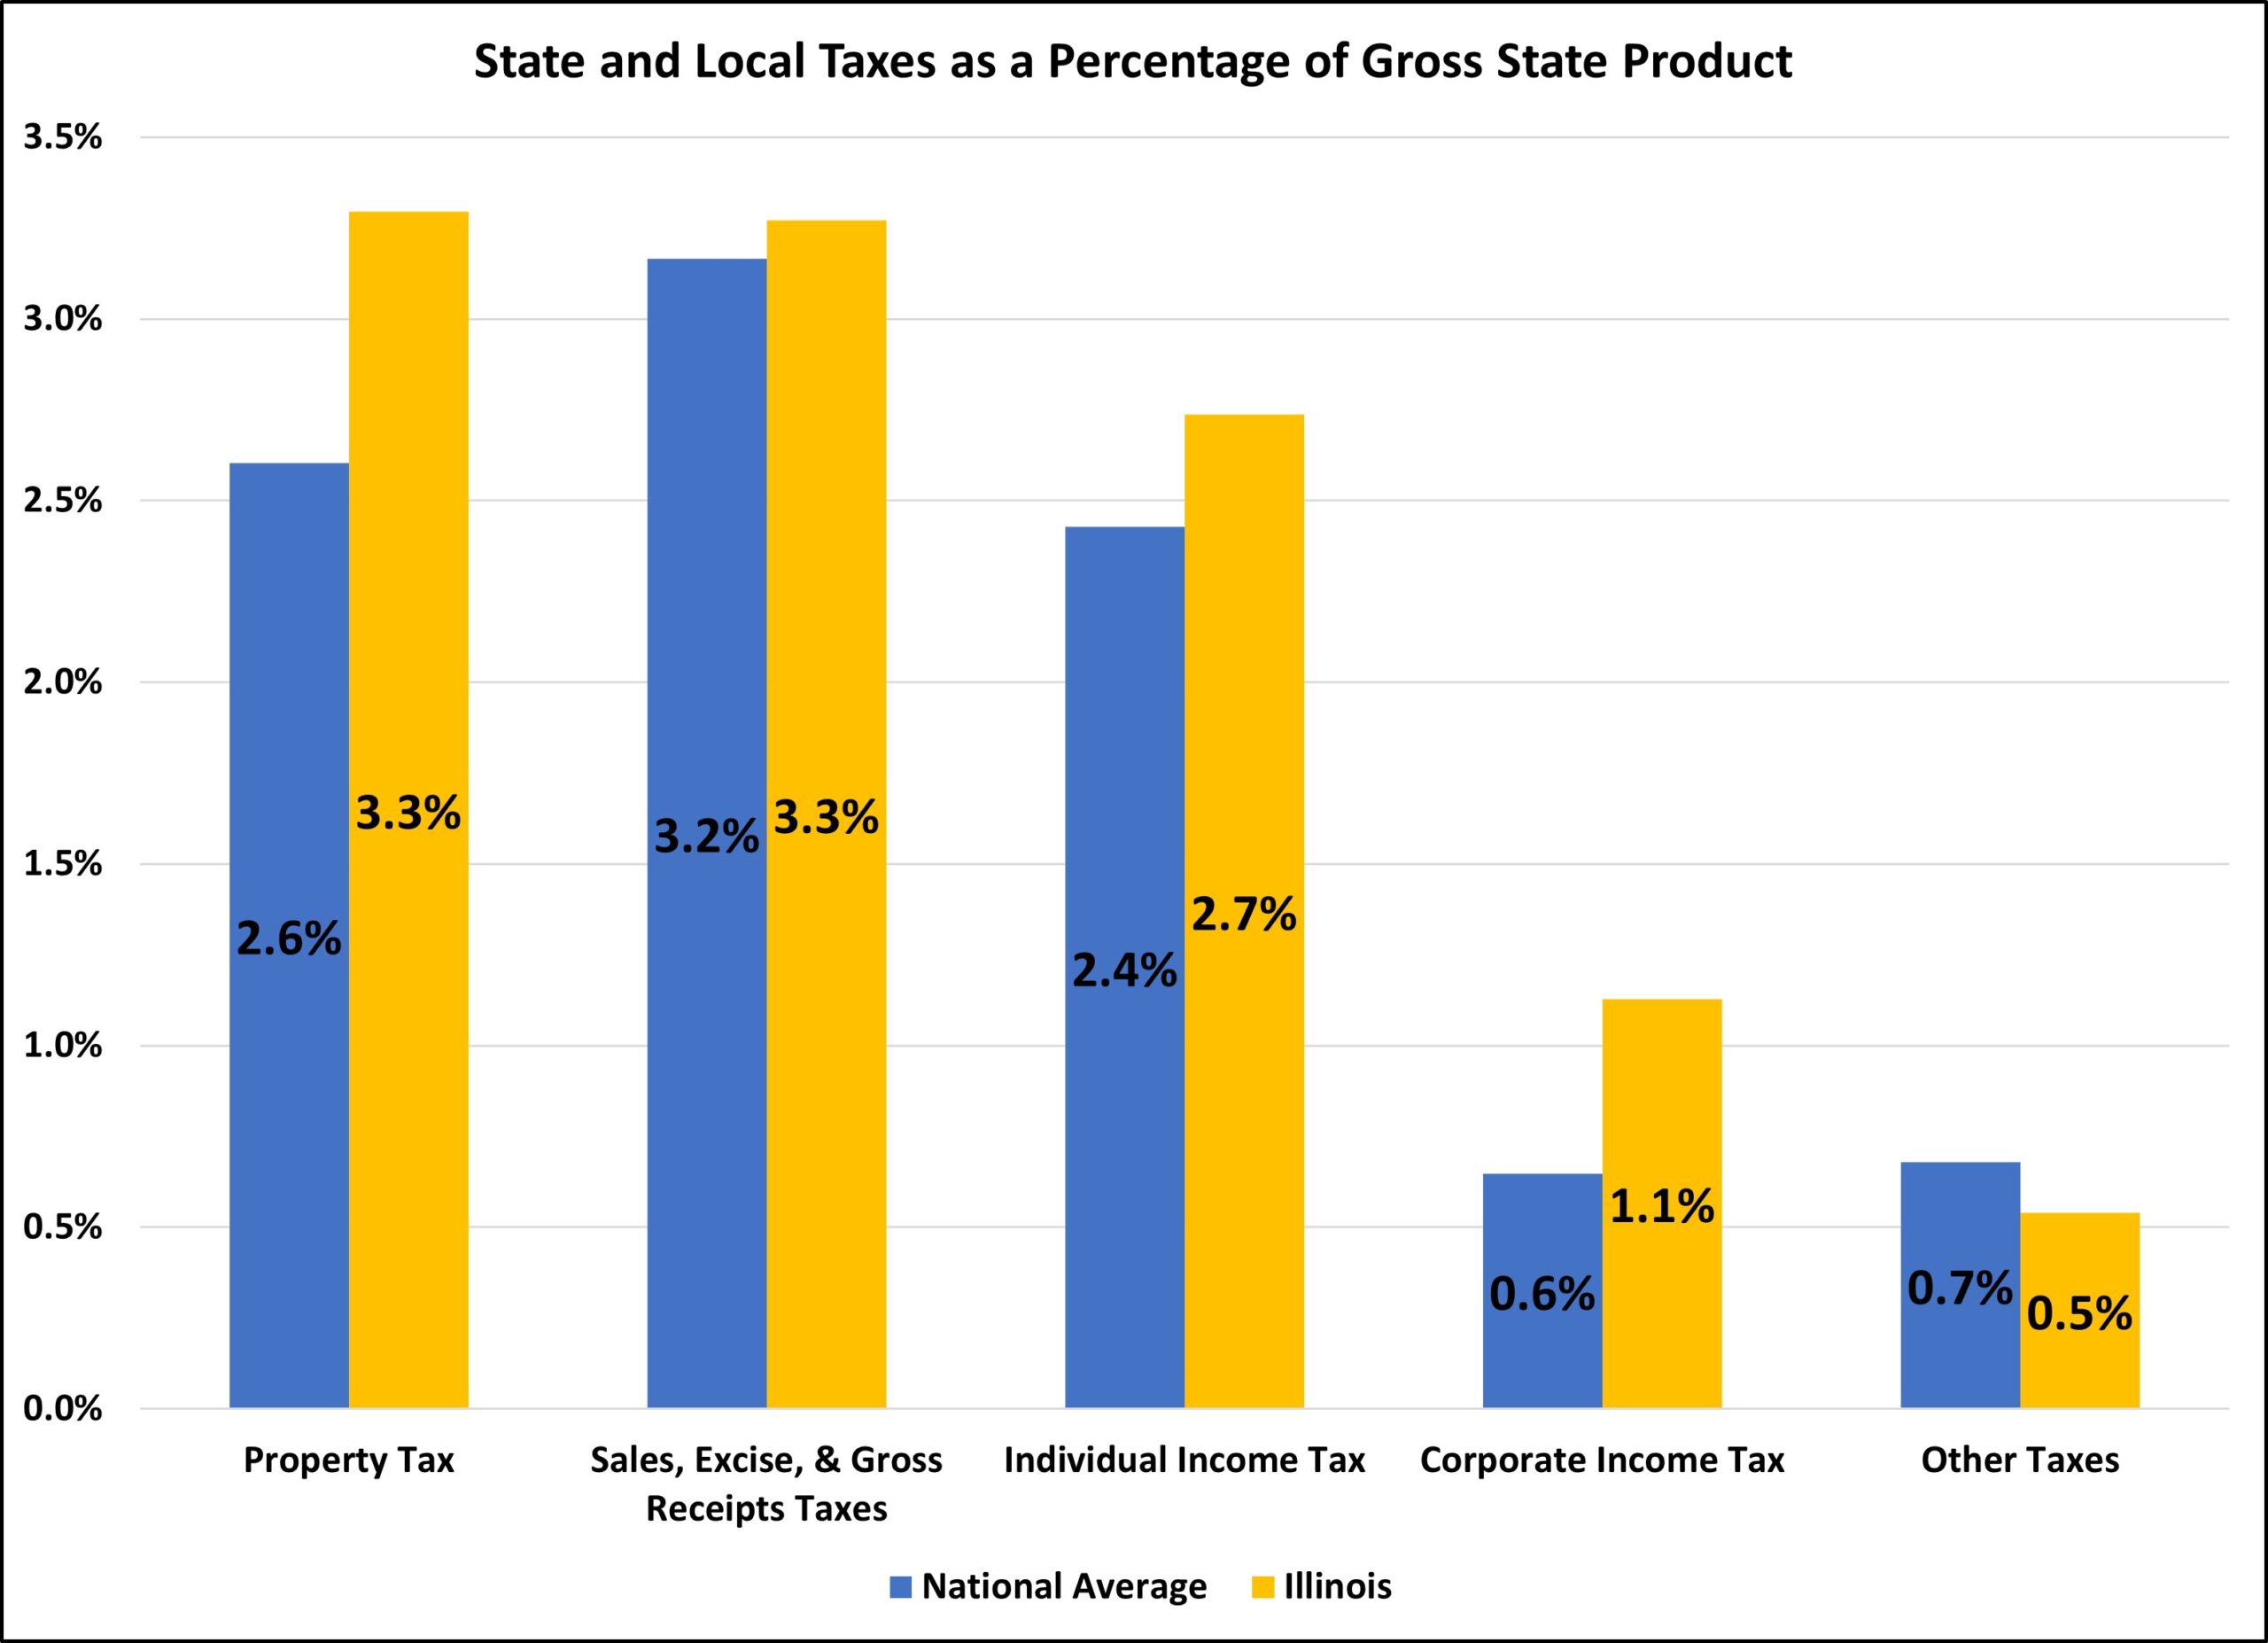
Illinois is above average in almost all of the U.S. Census tax categories, with the exception of “other taxes.” Property taxes in Illinois are 27% higher than the national average. Individual income taxes are only 13% higher than the national average. However, corporate income taxes are 75% higher. This is primarily due to Illinois’ high corporate income tax rate and the personal property replacement tax.
TAXES IN ILLINOIS ARE ABOVE AVERAGE
Source: U.S. Census Bureau, State and Local Government Finances and Bureau of Economic Analysis,
TFI Calculations
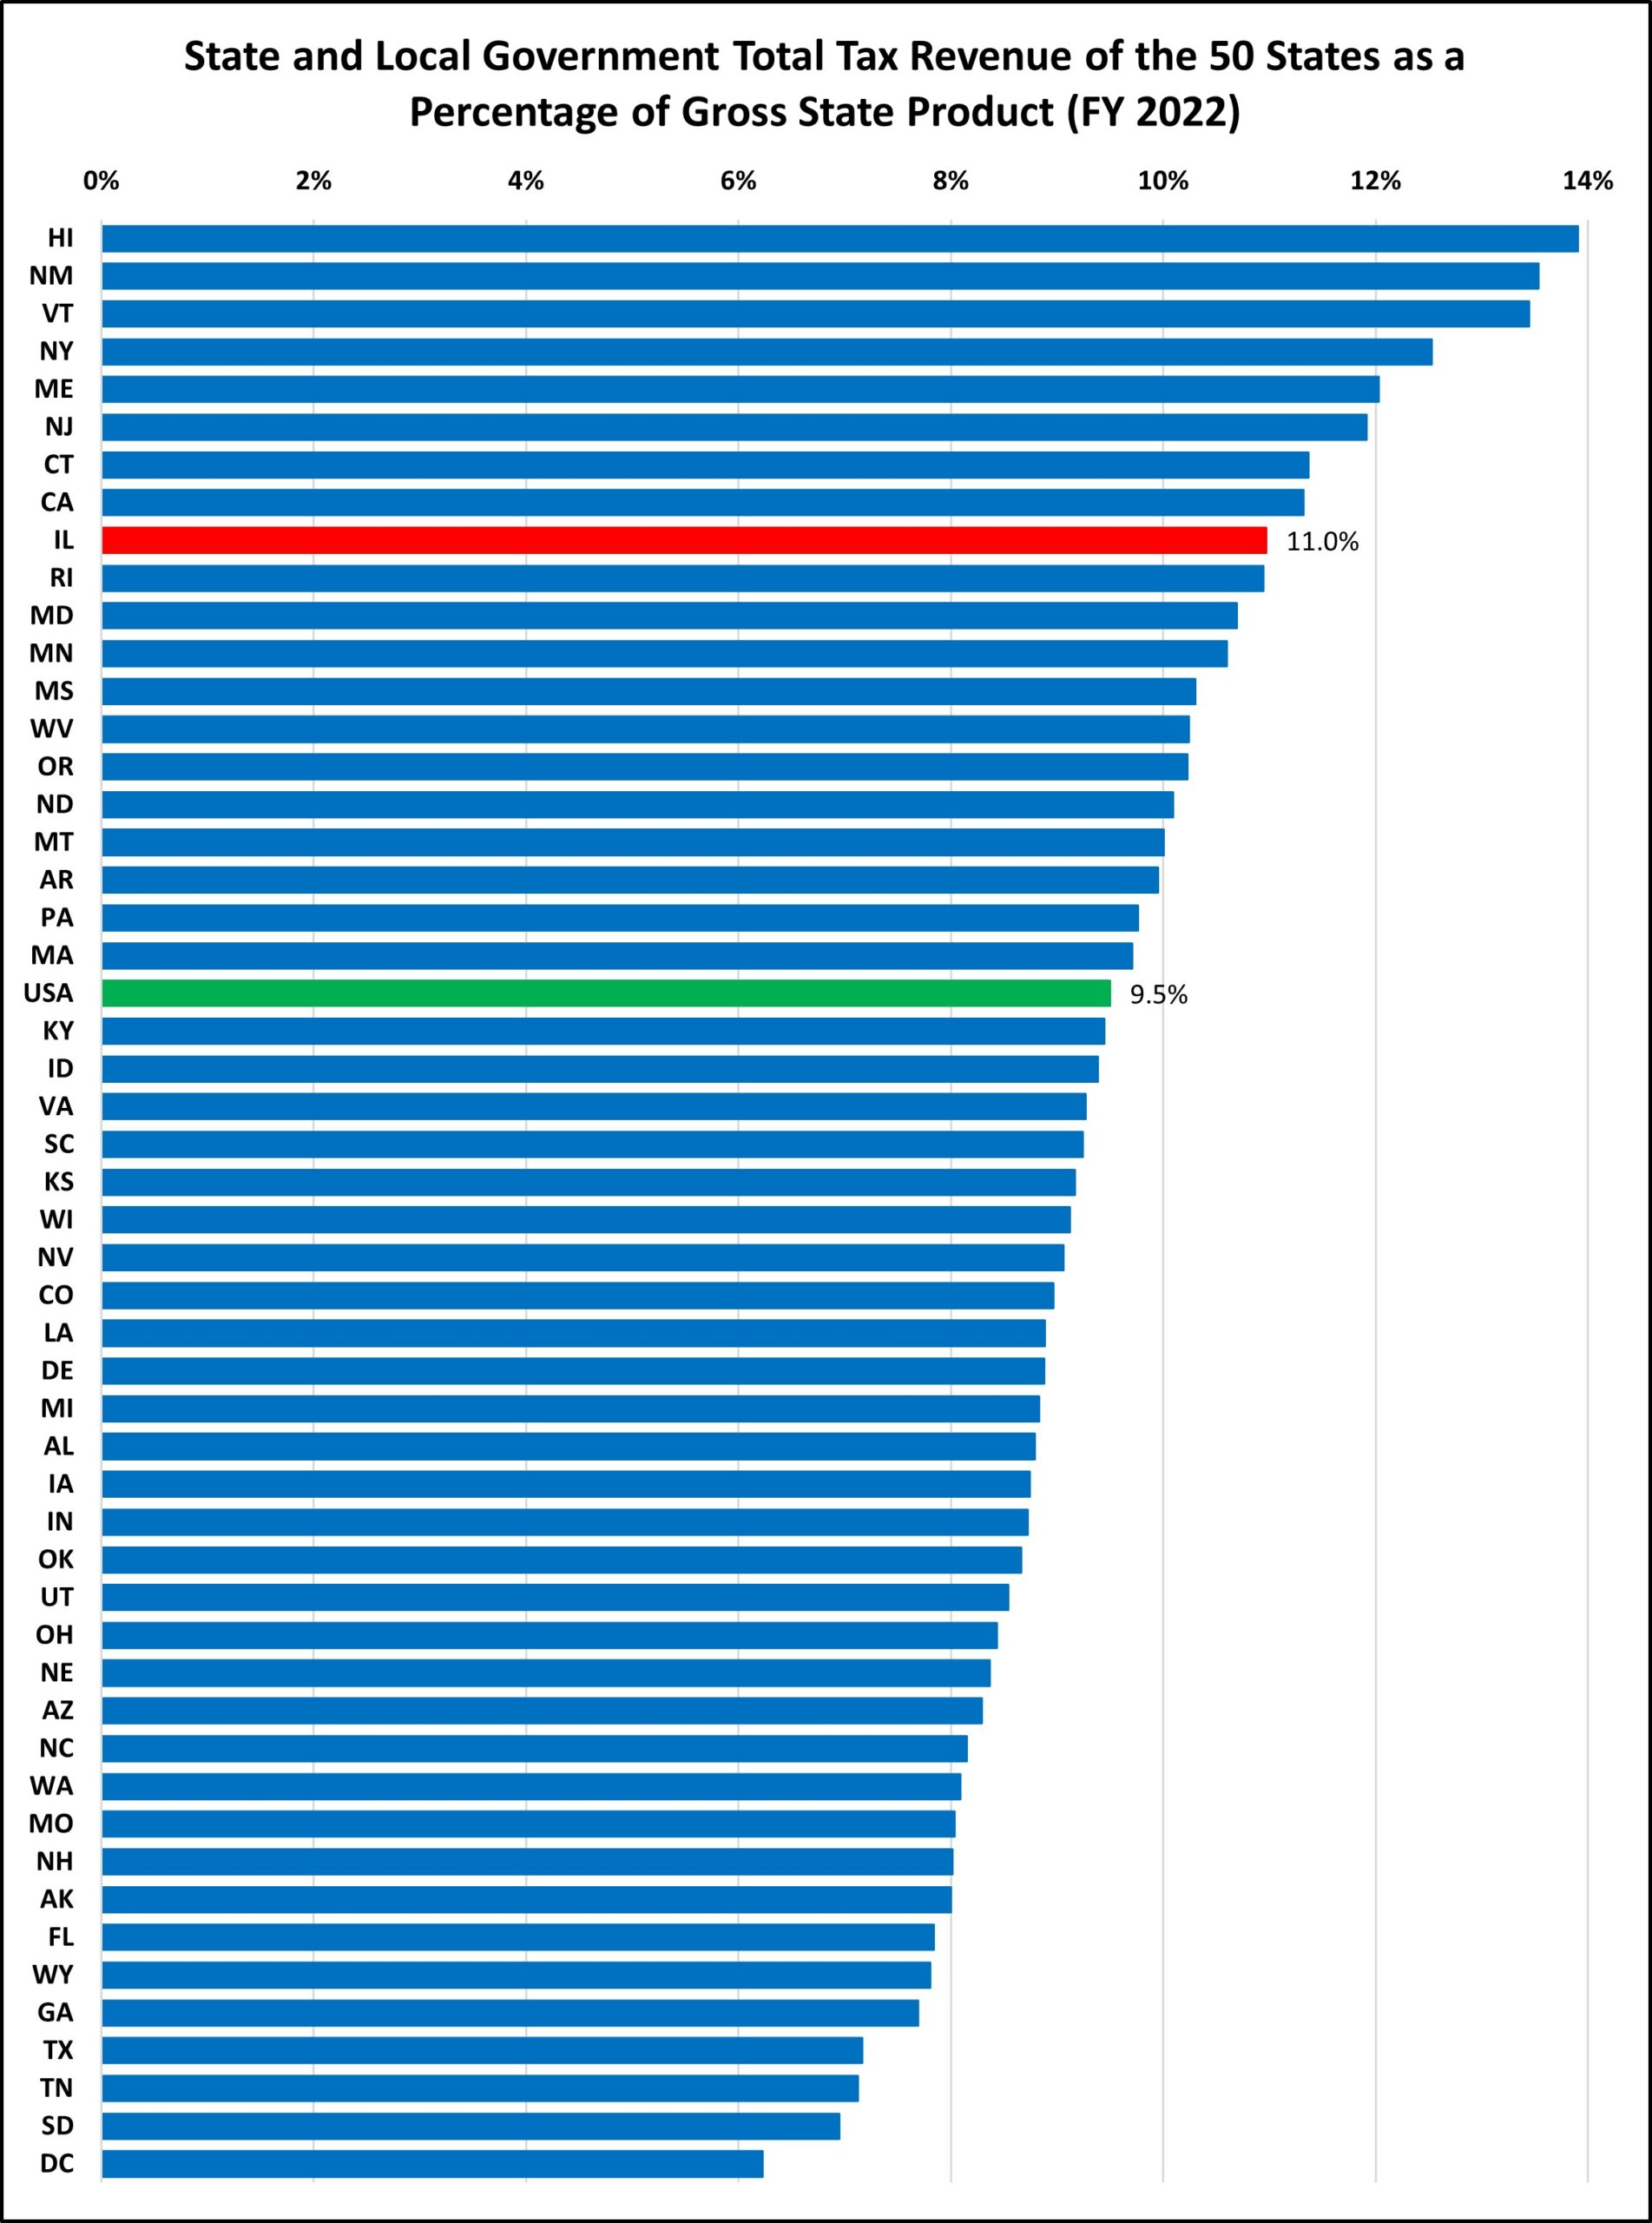
In FY 2022, Illinois had the 9th highest total tax collections when measured as a percentage of gross state product, at 11%. This is 16% above the national average. In total, Illinois state and local governments collected nearly $109 billion in taxes—$14 billion more than would have been collected if Illinois were at the national average. Among states with a flat income tax, Illinois has the highest tax collections.
PER CAPITA TAXES IN ILLINOIS ARE HIGH

Source: U.S. Census Bureau, State and Local Government Finances and Bureau of Economic Analysis,
TFI Calculations
Although per capita measurements fail to consider the states’ different economies, they still have a story to tell. When we say Illinois’ state and local taxes are 11.0% of gross state product, most people will gloss over the figure as it’s essentially a foreign language. Saying that Illinois’ state and local tax burden is $8,639 per person, on the other hand, it is easier to understand (even though few people would pay this exact amount). The national average per capita state and local tax collection is $7,109. The national average increased by $762 or 12% from FY2021, whereas Illinois saw an increase of $1,109 or 15%.
OWN SOURCE REVENUES SEEM TO TELL A DIFFERENT STORY
Source: U.S. Census Bureau, State and Local Government Finances and Bureau of Economic Analysis,
TFI Calculations
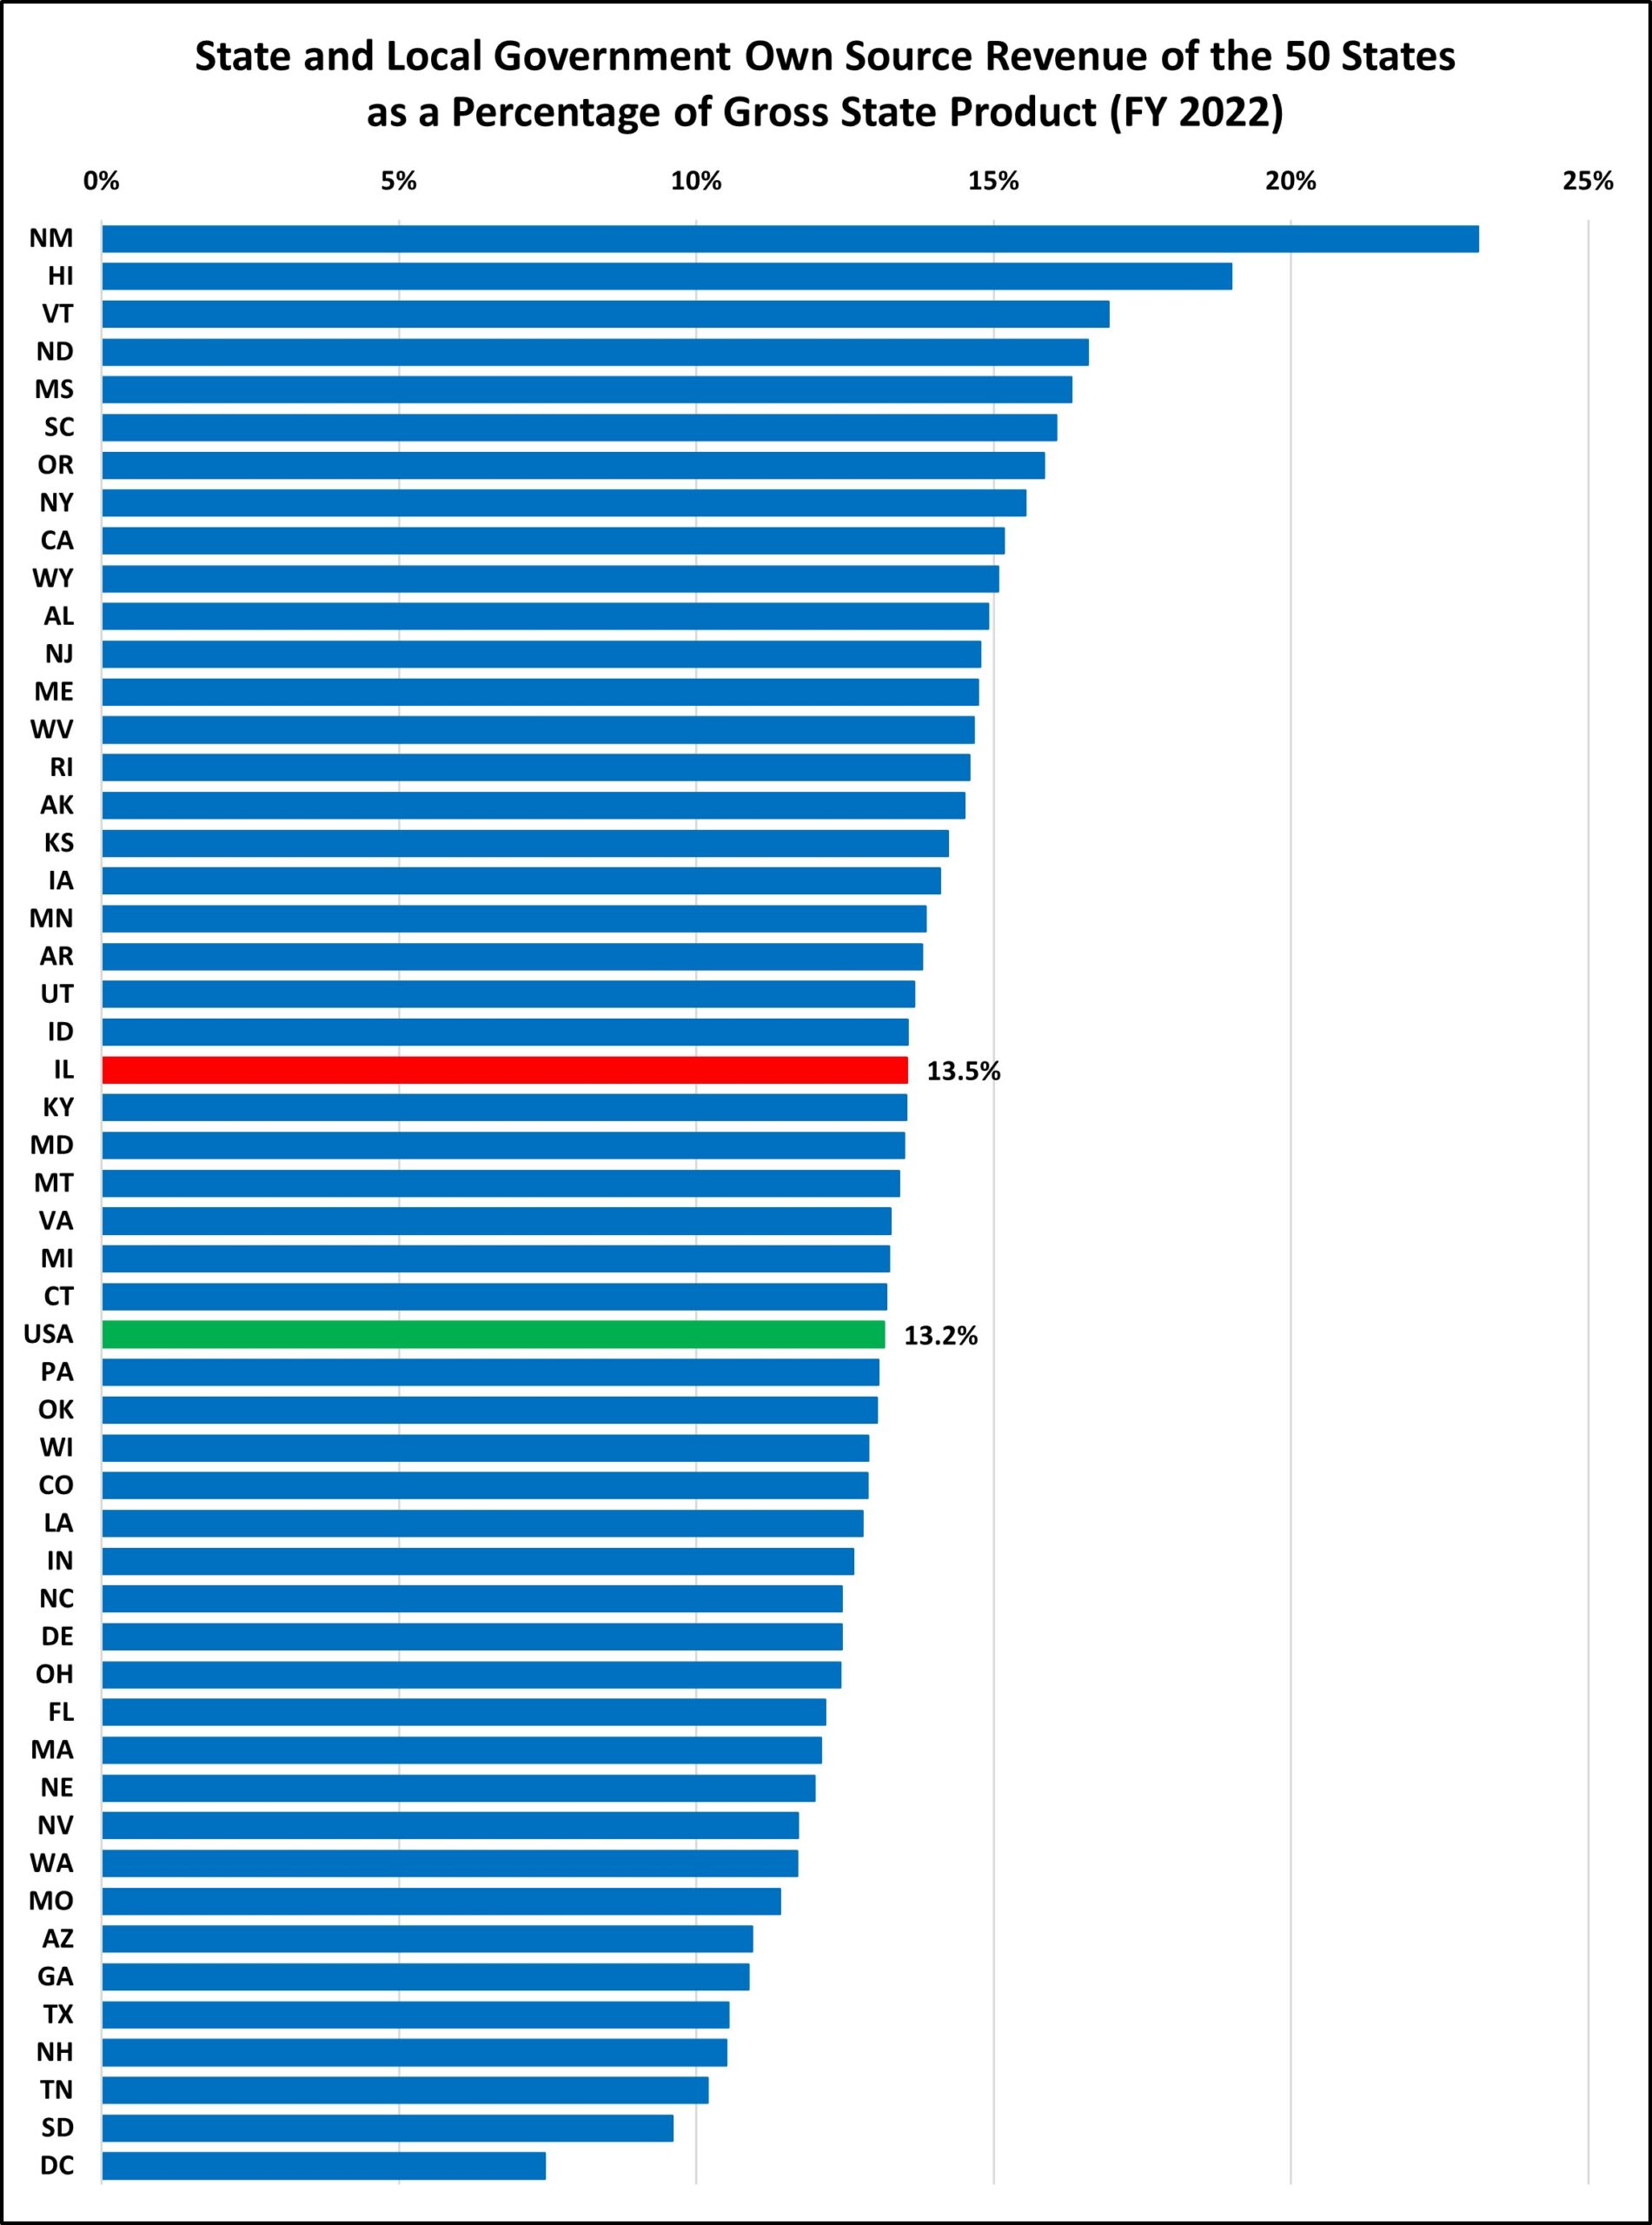
So far, we’ve compared total tax collections in Illinois (which includes income, sales, property, excise, utility, and other miscellaneous taxes, all categories used by the U.S. Census) to collections in other states. We have not yet looked at other revenues that state and local governments receive, such as fines, fees, college tuition, tolls, and similar sources. Some argue that a more inclusive figure—one that includes both taxes and fees (referred to as “own-source revenue” by the U.S. Census)—is a better benchmark, since a person doesn’t typically distinguish between a fee and a tax; both are paid to the government. However, most fees are for a specified service (or should be), such as students paying tuition to attend a state university or a driver paying a highway toll. Revenues from these fees are generally earmarked to fund the specific service (e.g., the university or the highway) rather than for general government purposes. Even so, it can be useful to examine this broader measure, which shows that Illinois is only slightly above the national average.
Tax revenues are above average, as shown in the previous charts, but total own-source revenues are about average. What accounts for this difference? Own-source revenue includes revenue from government-run hospitals. Illinois’ state and local governments collect only $210 per capita from government-run hospitals, while the national average is $671 per capita. Nationally, 18% of hospitals are run by state and local governments, while in Illinois, that figure is just 12%. This explains Illinois’ figure. If Illinois were at the national average for government-run hospitals, our state and local governments would collect an additional $6 billion in gross revenue from these facilities. (Given that government-run hospitals do not operate for profit, the revenue generated by these hospitals cannot be used to fund other government functions.)
While this own-source revenue comparison can be useful, understanding it requires examining what drives the difference: what fees or charges does Illinois collect less of compared to the national average, and whether Illinois provides those services with tax dollars or if they do not provide them at all.
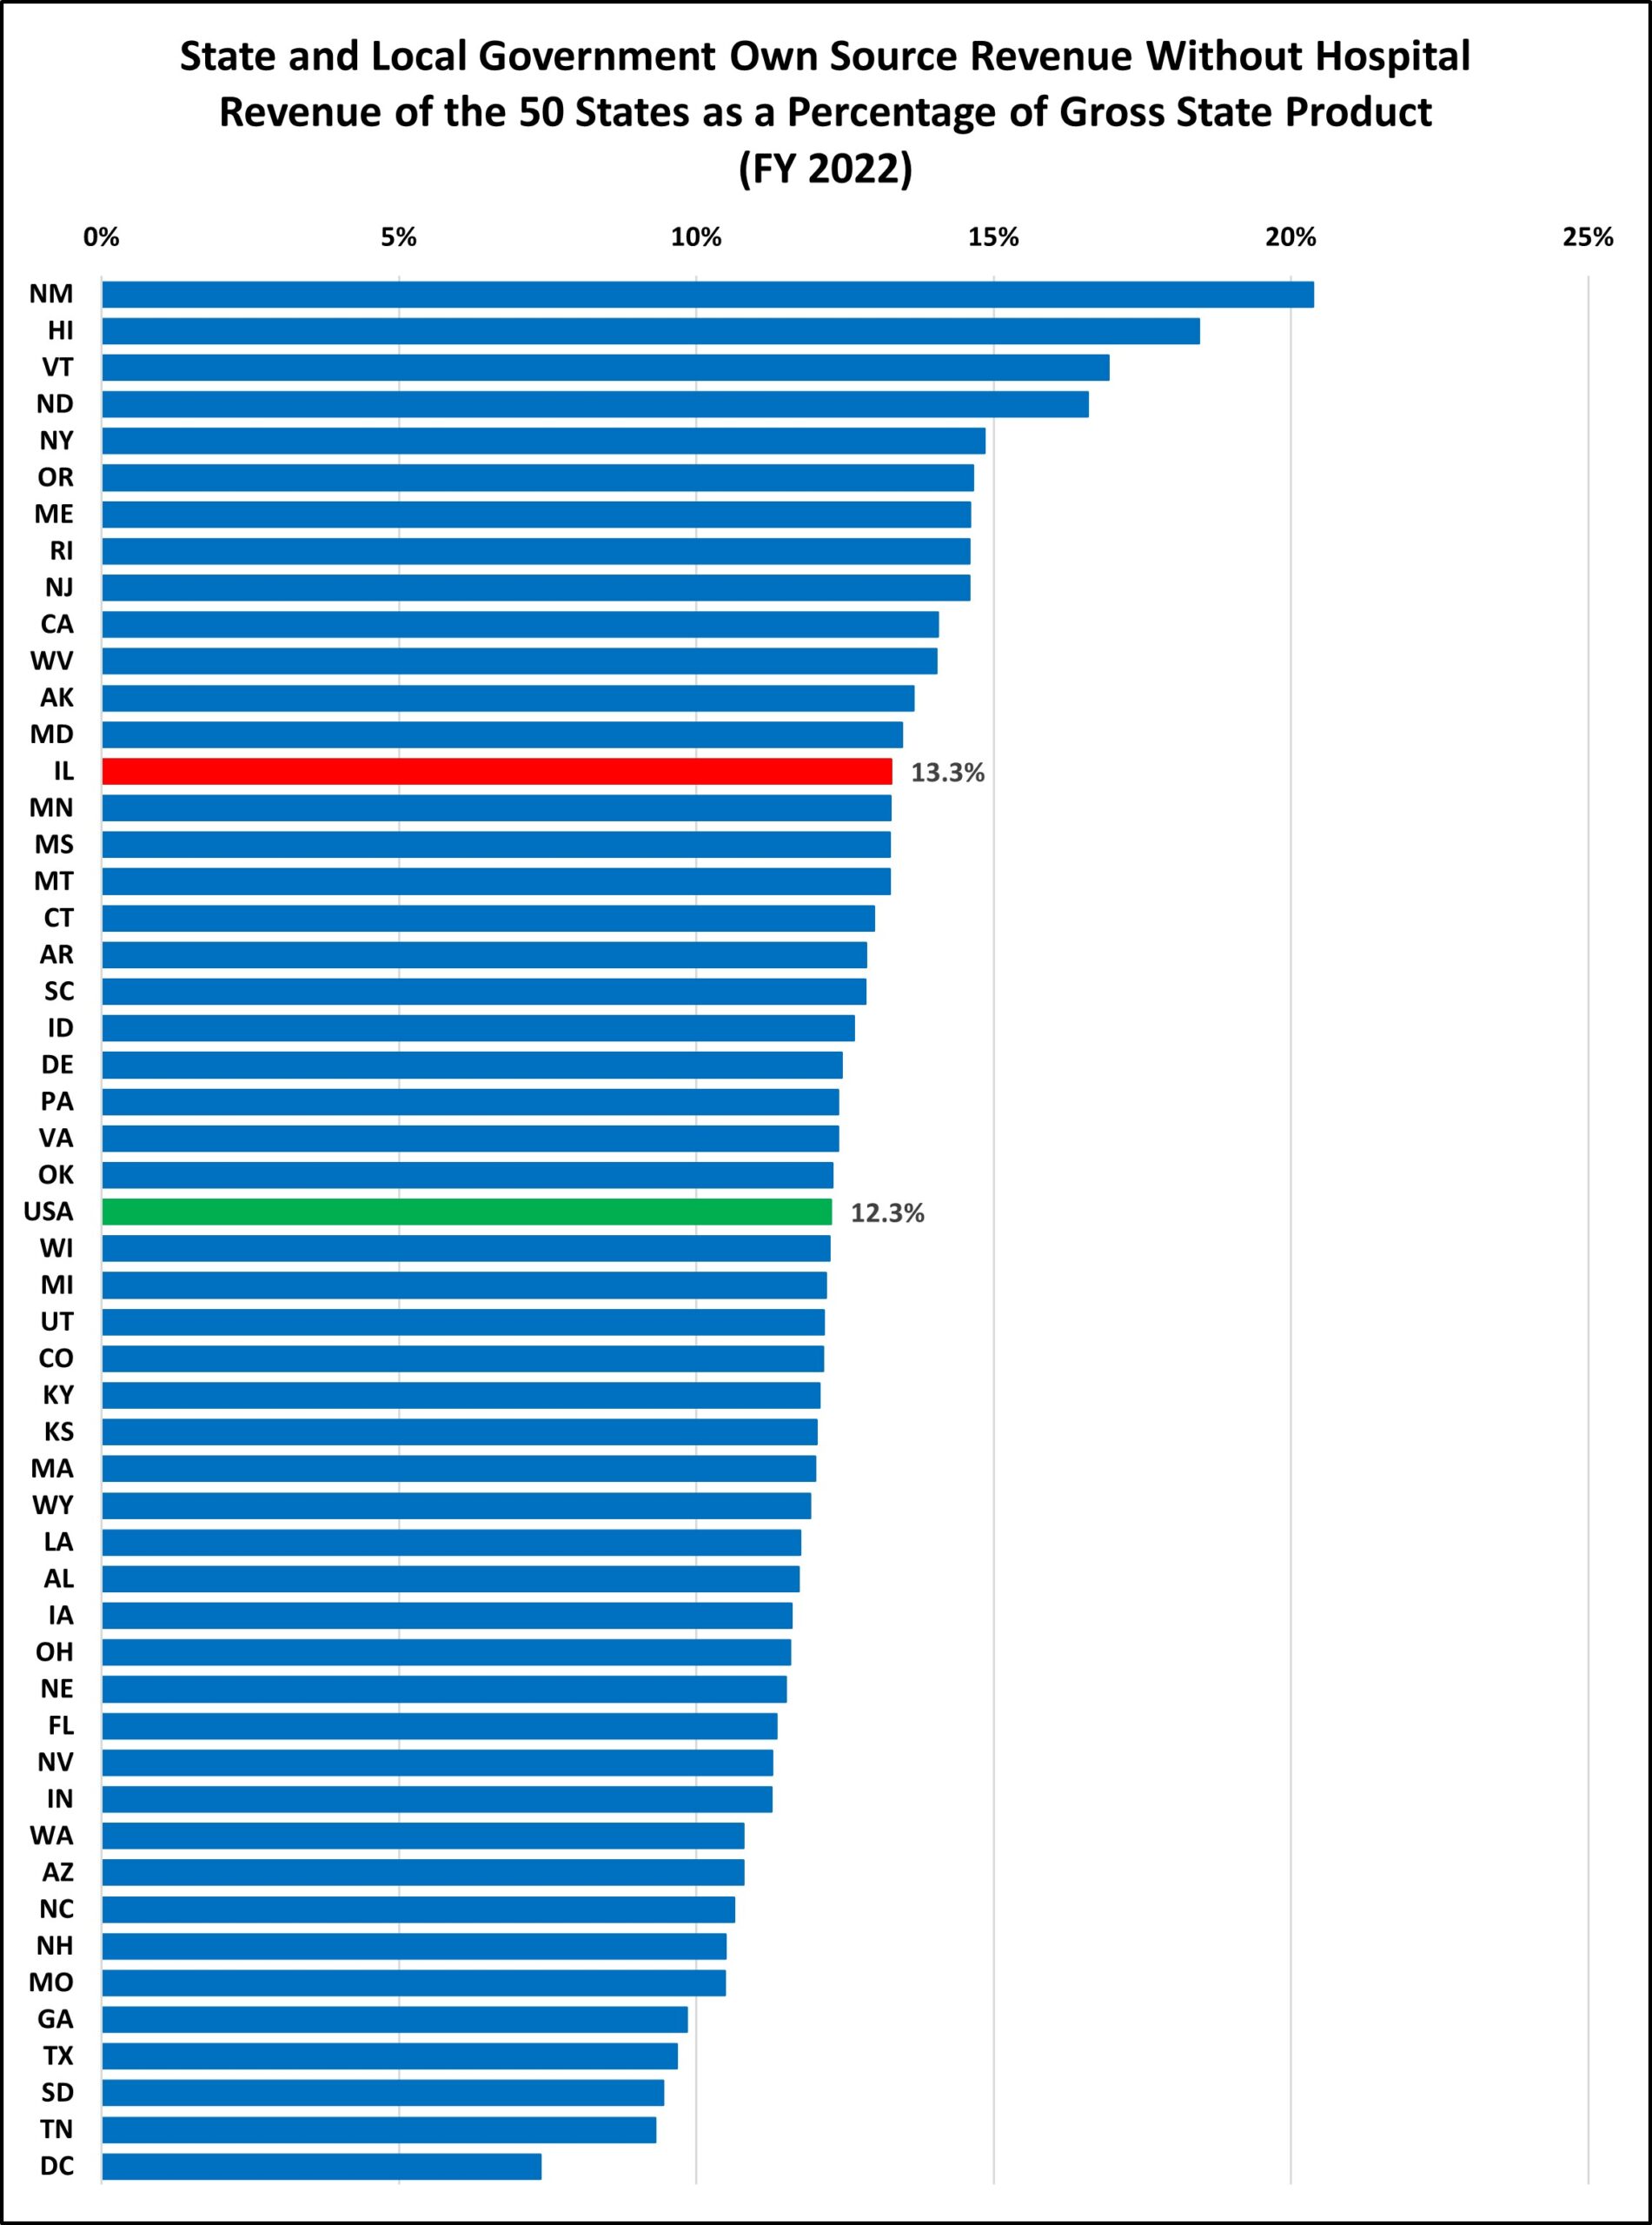
In this case, Illinois’ average ranking is primarily due to having fewer government-run hospitals, as shown in the following chart.
REMOVING HOSPITAL REVENUE RAISES ILLINOIS RANKING
Source: U.S. Census Bureau, State and Local Government Finances and Bureau of Economic Analysis,
TFI Calculations
When government hospital revenue is removed from the own source revenue data, Illinois’ ranking increases. Illinois went from average to slightly above average.
CONCLUSION
Are taxes in Illinois high? The answer is complicated, as is often the case when you ask a tax-related question.
When you look at the overall state and local tax burden, as we have done in this article, taxes in Illinois are above the national average, using most measuring sticks, and have trended higher in recent years. For those who believe taxes are too high, this shows that there is definite room for improvement. On the other hand, they aren’t the highest in the nation, and for those who seek additional government spending for various projects, they can argue there is capacity to raise taxes instead. Holders of these differing viewpoints may not be blind, but they frequently choose to look at things from a singular perspective, much like the blind men in our opening story.
In future issues of Tax Facts, we will take a deeper dive and show how Illinois compares to the rest of the country focusing on specific tax types: income, sales, and property taxes. And we will continue to present a variety of ways to answer the question: are taxes in Illinois high?
METHODOLOGY
Charts like these are only as good as the underlying data. To compare Illinois with other state we need to rely on data from the United States Census Bureau, specifically, the Annual Survey of State and Local Finances. Some states have taxes which do not fit neatly into one of the Census categories, such as Washington’s Business and Operations Tax, a gross receipts tax on businesses. Some might think it should be classified as a corporate income tax. However, the census classifies it as a sales and excise tax. There are other instances where the Census guidelines and classifications may not be intuitive, but for simplicity and consistency, we follow the Census classifications.
We are aware of discrepancies in the Census data as it is extremely difficult to collect this information from every state and local government in the country. Recently, there has been an error with Illinois’ individual and corporate income tax data. We continue to use corporate and individual income tax data from the Illinois Comptroller until the issue with the U.S. Census is resolved. For FY2022, the Department of Revenue misallocated $1 billion of individual income tax revenue as corporate income tax revenue. That mistake is reflected in this data and the correction will be reflected in the FY2024 data. In response to the state and local tax deduction at the federal level, a number of states enacted optional entity level taxes to allow taxpayers to get around the limitation. In some states, these taxes are considered a corporate income tax while in others, it is considered an individual income tax. Despite these faults with the Census data, it is the best data source of state and local government finances.
It should be noted that the Census did not perform the State and Local Government Survey in 2001 and 2003, so data is unavailable for those years.
Also note that in 1997, the U.S. Bureau of Economic Analysis changed how gross domestic product and gross state product were calculated, resulting in a slightly higher value and causing a break in the historical chart above.
